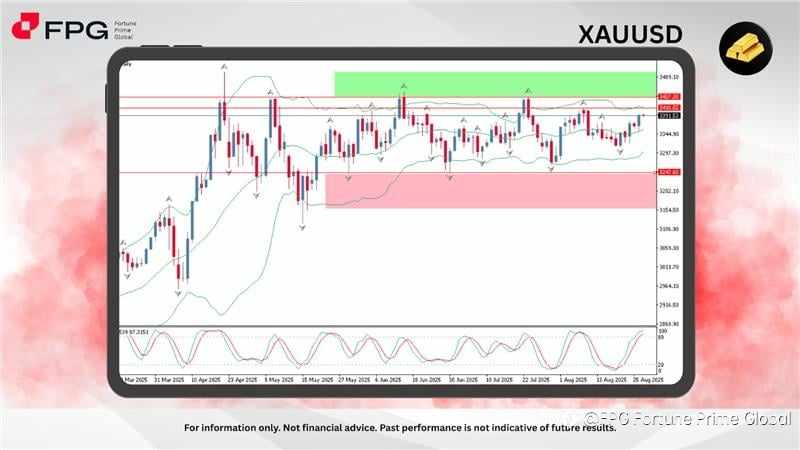
Gold (XAUUSD) continues to consolidate within a well-defined sideways structure, currently trading around 3391. The market has repeatedly tested the upper resistance zone between 3410 and 3437, but so far, bullish momentum has struggled to produce a sustained breakout. This area remains a significant barrier to the upside, while the lower boundary of the range is reinforced by support at 3345 and a stronger base at 3247, where buyers have consistently stepped in to absorb selling pressure. The repeated tests of both ends of the range highlight market indecision and the lack of a clear directional trend.
The Bollinger Bands are showing a gradual squeeze, with price leaning toward the upper band. This suggests a buildup of pressure that could precede a directional move, though confirmation is still needed. The fact that candles remain capped near resistance reflects hesitation among buyers, despite short bursts of upside momentum. At the same time, the Stochastic oscillator is trading in the overbought zone, which could indicate waning bullish strength in the short term and raises the possibility of a corrective pullback unless bulls can firmly push through resistance.
From a broader perspective, the outlook remains neutral to cautiously bullish. As long as prices hold above 3345, the technical bias leans in favor of buyers. A decisive breakout above 3437 would open the way toward 3489, marking a potential resumption of upward momentum. On the other hand, failure to overcome the resistance zone could trigger renewed selling pressure, dragging prices back toward 3345 and, in a deeper move, to 3247. Traders are advised to monitor the current consolidation carefully, as a breakout from this prolonged range may provide the next significant trading opportunity.
Market Observation & Strategy Advice:
1. Current Position: Currently around 3391, consolidating within a sideways range after repeated attempts to break higher. Price is leaning toward the upper boundary but lacks clear breakout confirmation.
2. Resistance: Immediate resistance stands at 3410, followed by a stronger ceiling at 3437. A successful breakout above this zone could expose the next upside target near 3489.
3. Support: The first line of support is seen at 3345, while stronger demand lies at 3247, where price has consistently found buyers during previous pullbacks.
4. Indicators: The Bollinger Bands show price nearing the upper band, reflecting short-term bullish pressure within consolidation. The Stochastic oscillator is in the overbought zone, signaling that upside momentum may be losing steam and raising the risk of a pullback.
5. Trading Strategy Suggestions:
- Range Traders: Look for selling opportunities near 3410–3437.
- Buyers: Consider dip entries around 3345–3247, targeting a rebound toward resistance.
- Breakout Traders: Wait for a decisive daily close above 3437 for long positions targeting 3489, or below 3247 for short positions aiming toward the 3155 region.
- Risk management: Use controlled position sizing with clear stop-loss levels, keeping risk minimal until price breaks decisively out of its current consolidation range.
Market Performance:
Precious Metals Last Price % Change
XPTUSD 1,346.55 −0.05%
XAGUSD 38.6413 +0.08%
Today’s Key Economic Calendar:
AU: Monthly CPI Indicator
DE: GfK Consumer Confidence
UK: CBI Distributive Trades
US: MBA 30-Year Mortgage Rate
US: EIA Crude Oil Stocks Change
US: Fed Barkin Speech
Risk Disclaimer This report is for informational purposes only and does not constitute financial advice. Investments involve risks, and past performance does not guarantee future results. Consult your financial advisor for personalized investment strategies.
Tuyên bố miễn trừ trách nhiệm: Quan điểm được trình bày hoàn toàn là của tác giả và không đại diện cho quan điểm chính thức của Followme. Followme không chịu trách nhiệm về tính chính xác, đầy đủ hoặc độ tin cậy của thông tin được cung cấp và không chịu trách nhiệm cho bất kỳ hành động nào được thực hiện dựa trên nội dung, trừ khi được nêu rõ bằng văn bản.


Tải thất bại ()