In trading, understanding market behavior is crucial for making the right decisions. Followme provides two key data sets that help traders gain deeper insights into market movements: Pending Order Data and Position Data. With these two tools, you can visualize potential support and resistance zones, market sentiment, and even the likelihood of breakouts.This #LearnFollowme article explains what these charts mean, how they work, and how you can use them to improve your trading strategy.
What Data Is Available?
-
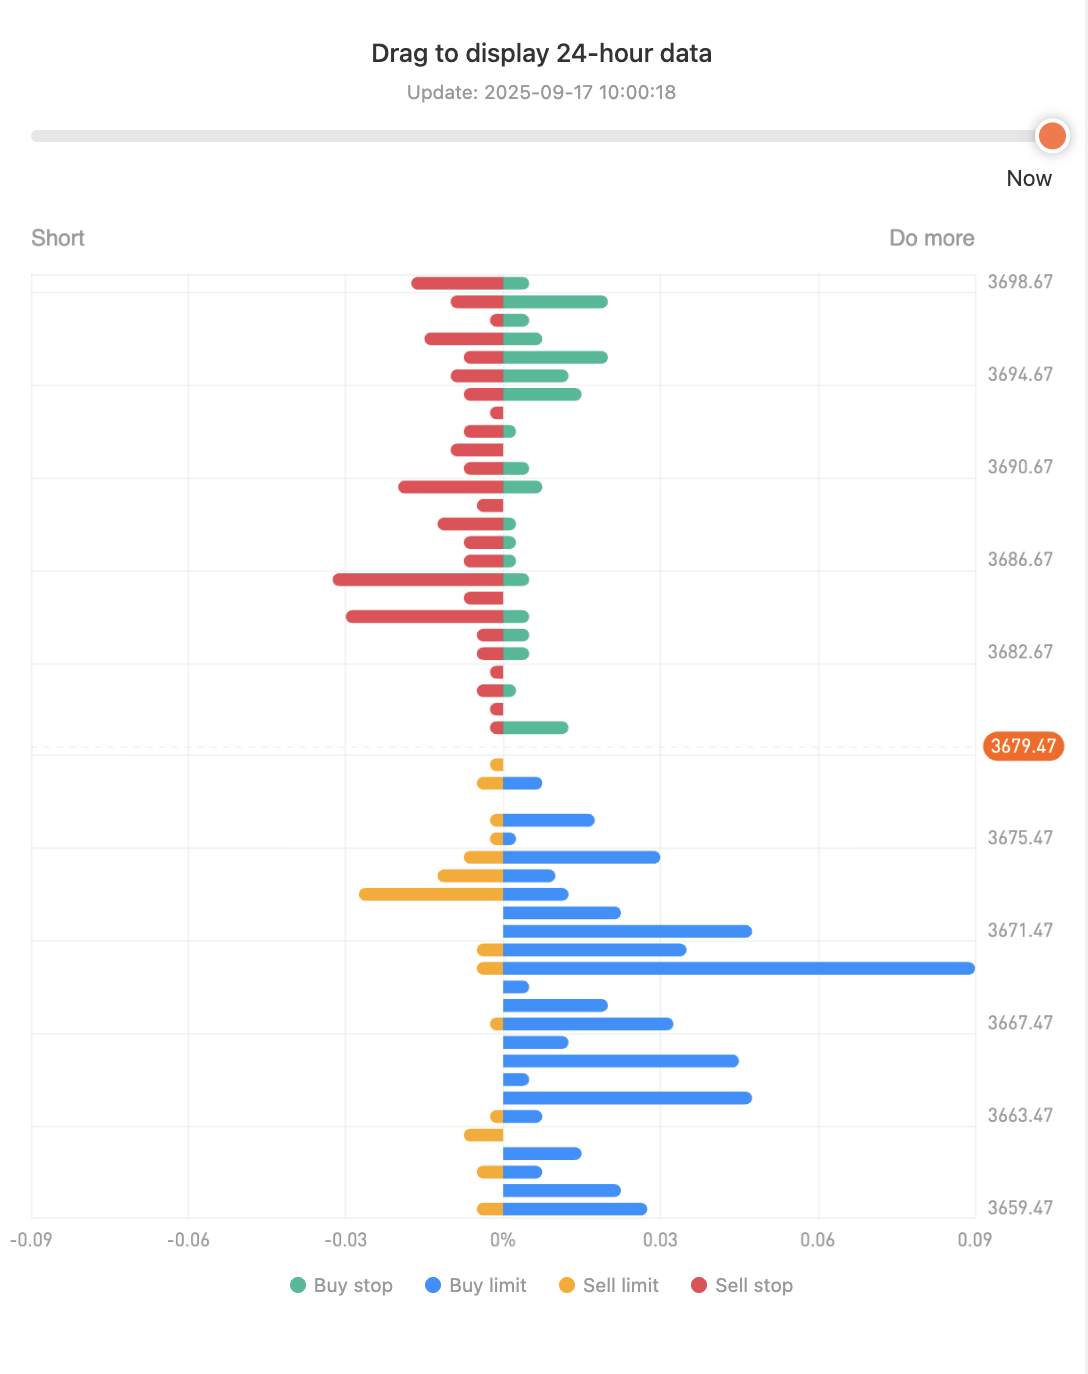
Green (Buy Stop): Traders expect the price to rise and will buy if it breaks above a certain level.
-
Blue (Buy Limit): Traders want to buy at a lower price than the current one.
-
Orange (Sell Limit): Traders want to sell at a higher price than the current one.
-
Red (Sell Stop): Traders will sell if the price drops below a certain level.
-
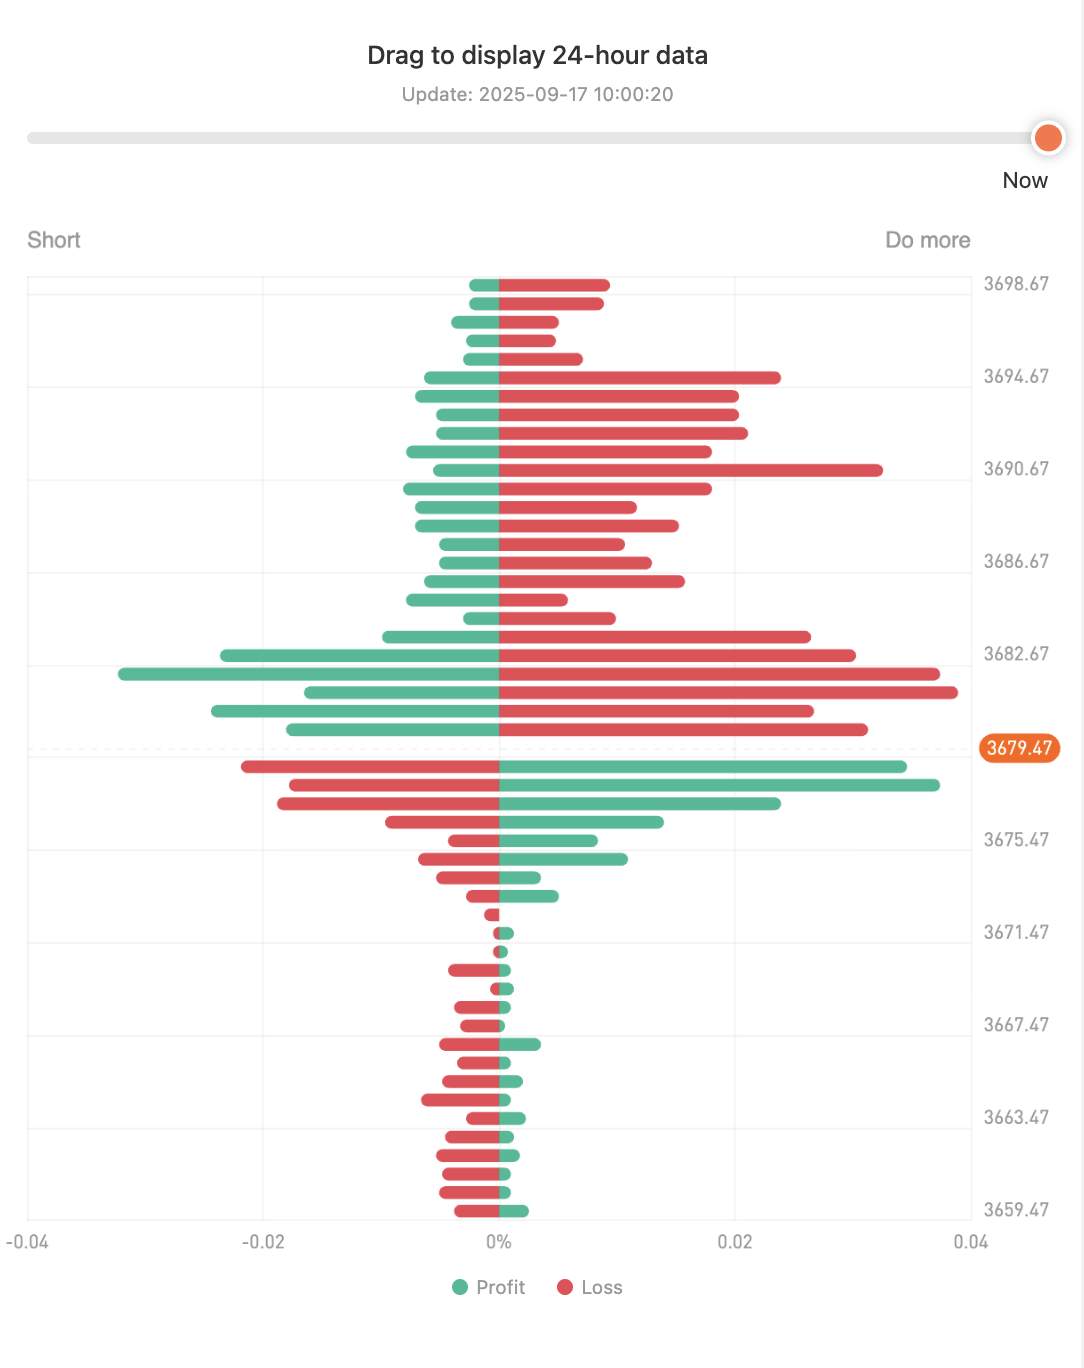
Green indicates positions in profit.
-
Red indicates positions in loss.
How to Access It
-
Click the “Market” menu.
-
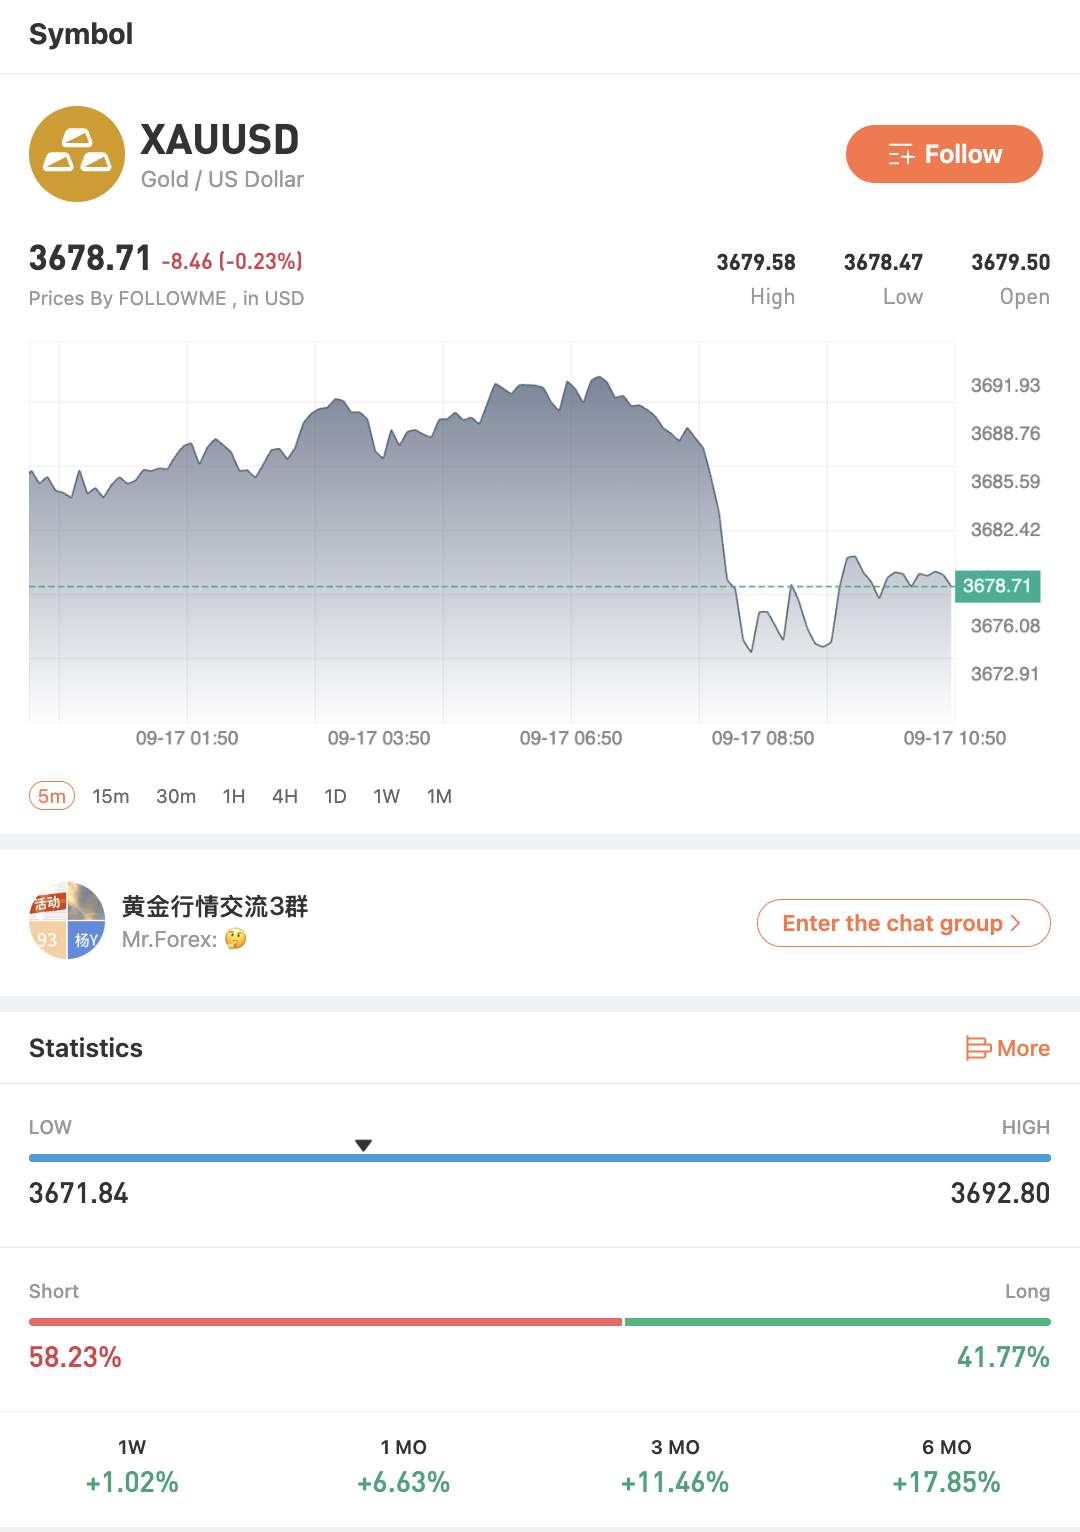
Select the symbol you want to analyze (e.g., XAUUSD).
-
Click the symbol to go to the detail page.
-
Scroll down to the “Statistics” section and click “More.”
What Is the Purpose of This Data?
-
Identify potential support/resistance levels based on order concentrations.
-
Spot key price levels where most traders are focused.
-
Read unexecuted buying or selling pressure (via pending orders).
-
Analyze changes in open positions over the last 24 hours.
-
Where are most traders placing their orders?
-
Which price levels are likely to act as support or resistance?
Why Is This Data Important?
How Can This Help Traders?
XAUUSD Chart Analysis (Gold / US Dollar)
How This Data Can Help Traders?
-
Support: If you see clear signs of a price rebound as it approaches the daily low of $3671.84, you might consider this a potential support level to enter a long (buy) position. You can then place your stop-loss order slightly below this level to manage risk.
-
Resistance: Conversely, if the price moves up to test the daily high of $3692.80 and shows signs of a reversal, such as strong selling pressure, you could consider this a potential resistance level to enter a short (sell) position. Your stop-loss order could be placed just above this level.
Tips for Traders
-
Combine with Price Action: Use this data together with candlestick patterns for breakout confirmation.
-
Watch Daily Changes: Pull up 24-hour data to observe how positions evolve.
-
Use as a Complement, Not the Only Tool: Best results come when combining with indicators like volume, RSI, or trend tools.
Final Thoughts
-
Identify critical price levels
-
Adjust entry/exit strategies
-
Understand market movements from the lens of trader psychology
Tuyên bố miễn trừ trách nhiệm: Quan điểm được trình bày hoàn toàn là của tác giả và không đại diện cho quan điểm chính thức của Followme. Followme không chịu trách nhiệm về tính chính xác, đầy đủ hoặc độ tin cậy của thông tin được cung cấp và không chịu trách nhiệm cho bất kỳ hành động nào được thực hiện dựa trên nội dung, trừ khi được nêu rõ bằng văn bản.

Để lại tin nhắn của bạn ngay bây giờ