For traders diving into quantitative analysis or strategy testing, one common roadblock is accessing usable market data. You can track prices on trading platforms or apps, but when it comes to backtesting a strategy, running time-series analysis, or validating trading models, unstructured data that can’t integrate with code becomes a major hassle.
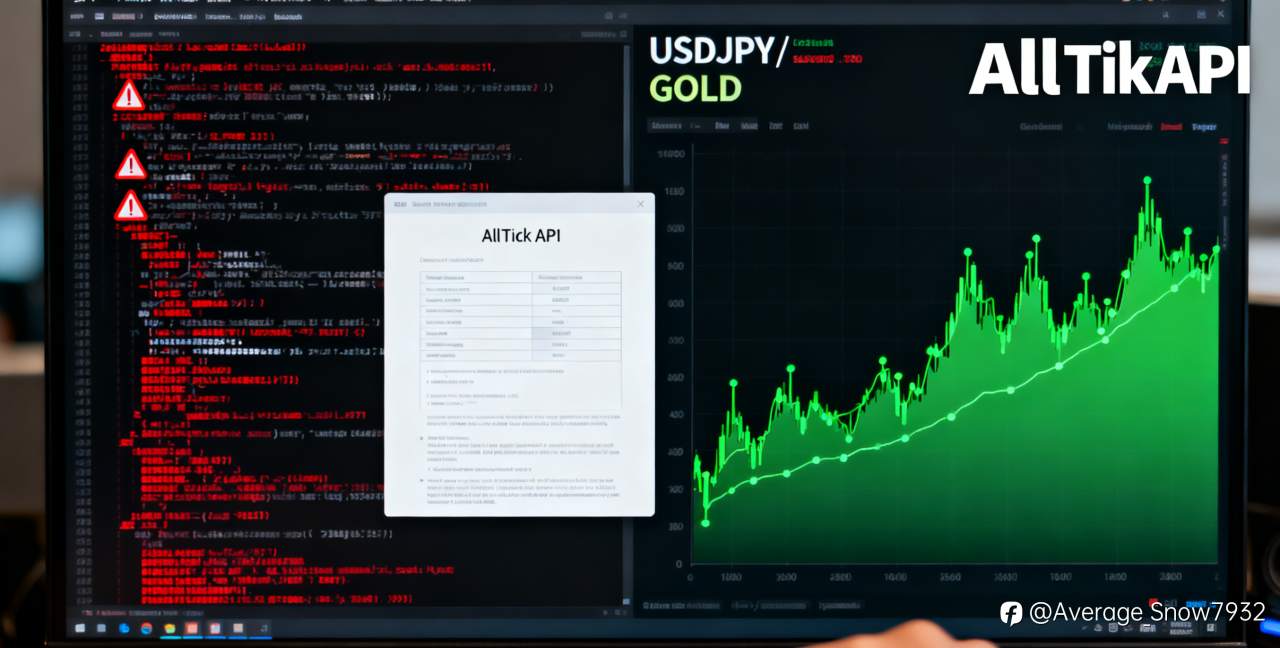
The good news is that building a simple, reliable data pipeline doesn’t require advanced coding skills. In this guide, we’ll walk through a straightforward method to fetch real-time K-line data for Forex pairs (like USDJPY, EURUSD) and precious metals (such as GOLD, XAUUSD) using Python—we’ll use AllTick’s K-line API for the demo, as it’s known for its intuitive setup and broad coverage of mainstream assets, making it a practical choice for traders new to data automation. The process is beginner-friendly, takes no more than 10 minutes to set up, and the code is ready to copy-paste—perfect for traders looking to add data-driven insights to their workflow.
I. A Trader’s Guide to Choosing Market Data Sources
When it comes to quant-related work (even for casual traders), the best data sources need to be easy to access, consistent, and compatible with tools like Python. After testing various options, here’s a practical ranking based on real-world usability:
1. Programmable APIs (Most Reliable for Traders)
APIs (Application Programming Interfaces) are designed to share data between systems, making them ideal for traders who want to automate data collection. Key benefits include:
- Deliver structured JSON data that Python can parse instantly—no manual formatting or data cleaning needed
- Allow customization of K-line intervals (1min/5min/hourly, etc.), data volume, and time ranges to match your strategy
- Provide consistent, repeatable results—critical for testing if a strategy works across different time periods
- Cover major Forex pairs and precious metals, so you don’t have to switch between multiple platforms
- Support both one-time batch requests (HTTP) and real-time updates (WebSocket)
For this tutorial, we’ll use a widely used K-line API that balances simplicity and functionality—no complex setup or hidden requirements, just straightforward access to the data you need.
2. Desktop Trading Terminals (Great for Viewing, Not Analysis)
Tools like MT4 or MT5 are essential for manual trading—they offer intuitive charts, indicators, and order execution. However, for data-driven work:
- Data can’t be exported in bulk (manually copying hundreds of data points is impractical)
- They don’t integrate directly with Python scripts, requiring extra work to extract usable data
- Historical data depth and format are limited by the platform, restricting flexibility
Use them for monitoring markets and executing trades, but not as your primary data source for analysis.
3. Financial News & Price Sites (Only for Quick Checks)
Sites that display real-time prices are useful for a quick glance, but they’re built for human reading, not automated data collection:
- Data is embedded in web pages (scraping this data is fragile—any site update can break your workflow)
- No standardized way to pull data programmatically, leading to wasted time on troubleshooting
Stick to these for on-the-go price checks, not for serious strategy testing.
4. Mobile Trading Apps (Convenient, But Not for Data Work)
Mobile apps are perfect for monitoring trades while away from your desk, but most don’t offer APIs to export raw data. Without access to structured data, their convenience doesn’t help with quant analysis—they’re just mobile chart viewers.
5. Broker Backend Data (Limited Use for Traders)
Some brokers provide real-time data in their client dashboards, but they’re not designed for external analysis:
- Data formats and refresh rates vary between brokers, making it hard to standardize your workflow
- You need to log in to the broker’s platform to access data—no way to automate bulk downloads
- Lack transparency on data latency and quality, which can skew strategy test results
They’re fine for checking your portfolio, but not for building a reliable data pipeline.
II. Step-by-Step: Fetch K-Line Data with Python
Let’s get into the practical part—follow these steps to start pulling data in minutes:
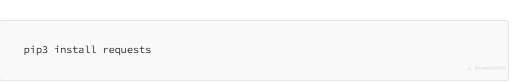
1. Install Required Tools
First, install the requests library (used to send data requests) with one simple command. Open your terminal or command prompt and run:
bash
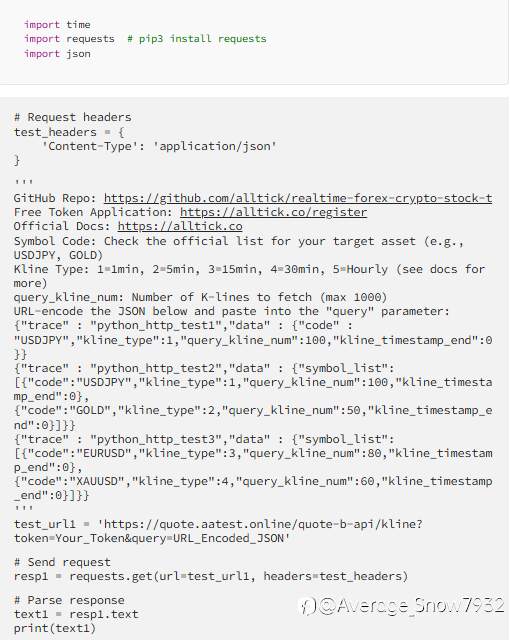
2. Full Python Code (Copy & Paste Directly)
python
3. Simple Parameter Explanation (No Jargon)
You only need to adjust a few key parameters to get the data you want:
code: The unique identifier for your asset (e.g., USDJPY for USD/JPY, GOLD for gold)—check the documentation for the full list of supported assetskline_type: The time interval of K-lines (1=1 minute, 2=5 minutes, etc.—hourly, daily, and monthly options are also available)kline_timestamp_end: Set to0to get the latest real-time data (no need to calculate timestamps manually)query_kline_num: How many K-line entries to fetch (max 1000—enough for short-to-medium-term strategy testing)trace: A custom label (like "forex_strategy_test") to help troubleshoot if the request fails
4. How to Run the Code (Beginner-Friendly Steps)
- Get a free access token: Visit the documentation site (linked in the code comments) to register—sign-up is quick, and you’ll get instant access to the free tier
- Find your asset’s code: Look up the
codefor the Forex pair or precious metal you want to analyze (e.g., GOLD for gold, EURUSD for Euro/USD) - Customize the JSON parameter: Use one of the JSON examples in the code comments—adjust
kline_typeandquery_kline_numto match your needs (supports single or multiple assets) - URL-encode the JSON: Use an online URL encoder tool (easily found via search) to convert your JSON string into a URL-safe format
- Update the request URL: Replace
Your_Tokenwith the token you received andURL_Encoded_JSONwith the encoded string from step 4 - Run the script: Execute the Python code, and you’ll get JSON-formatted K-line data—ready to use for analysis, backtesting, or visualization
III. Why This Workflow Is Useful for Traders
This method has become a go-to for traders looking to add data-driven insights because it’s:
- Time-saving: No more manual data entry or cleaning—JSON data works directly with Python tools like pandas for analysis or backtesting frameworks
- Consistent: The data is reliable and formatted uniformly, so your strategy tests aren’t skewed by messy or inconsistent data
- Flexible: Supports both single-asset and bulk queries, making it easy to analyze multiple pairs or metals at once
- Cost-effective: The free tier is more than enough for casual traders or those just starting with quant analysis—no need to pay for expensive data subscriptions
For traders new to data-driven strategies, getting your data pipeline right first is key. Once you can reliably pull the data you need, you can focus on refining your trading approach, testing hypotheses, and making more informed decisions.
Final Thoughts
You don’t need to be a coding expert to leverage data in your trading. With this simple Python workflow—powered by a user-friendly API like AllTick—you can build a reliable data pipeline in 10 minutes, giving you access to the structured K-line data needed for strategy testing and analysis.
If you run into issues (like URL encoding or parameter tweaks), refer to the documentation linked in the code or leave a comment below. For traders looking to level up their approach, this is a foundational skill that opens the door to more advanced quant techniques.
Tuyên bố miễn trừ trách nhiệm: Quan điểm được trình bày hoàn toàn là của tác giả và không đại diện cho quan điểm chính thức của Followme. Followme không chịu trách nhiệm về tính chính xác, đầy đủ hoặc độ tin cậy của thông tin được cung cấp và không chịu trách nhiệm cho bất kỳ hành động nào được thực hiện dựa trên nội dung, trừ khi được nêu rõ bằng văn bản.

Để lại tin nhắn của bạn ngay bây giờ