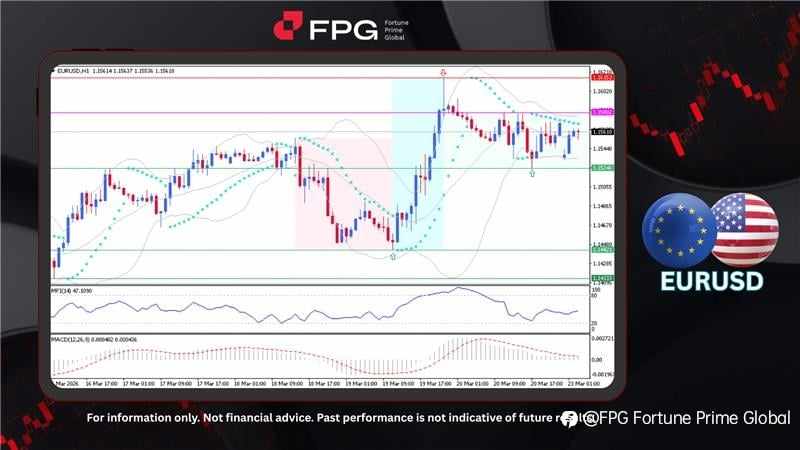
On the H1 timeframe chart, EURUSD previously experienced a bearish movement, followed by a bullish trend reversal from 1.1442 to 1.1615. After this upward move, price action stabilized and shifted into a sideways ranging structure between 1.1524 and 1.1580. The current price is trading around 1.1561, reflecting relatively low volatility and a consolidation phase following the recent bullish impulse.
From a technical perspective, Bollinger Bands are beginning to narrow, indicating reduced volatility and a consolidating market environment. Price is hovering near the middle band, suggesting neutral momentum without strong directional bias. The Parabolic SAR has shown frequent flips around price, reinforcing the ongoing indecision. Meanwhile, the MFI remains near the mid-level, pointing to balanced buying and selling pressure, while the MACD shows fading bullish momentum with a flattening signal.
Eurozone economic conditions remain fragile as inflation pressures persist, driven by elevated energy prices and ongoing geopolitical tensions, prompting the European Central Bank to maintain a cautious stance. Growth outlooks have been revised lower due to weak external demand and subdued industrial activity, although supported by resilient labor markets and gradual domestic recovery. At the same time, businesses face margin pressure from high input costs, contributing to mixed sector performance and relatively stable EURUSD movement.
Technical Market Overview
1. Current Position: EURUSD is trading around 1.1561, moving sideways after a strong bullish reversal from 1.1442 to 1.1615, indicating a consolidation phase within a short-term range.
2. Resistance Zone: The nearest resistance is located at 1.1580, aligning with the upper boundary of the current range, while a stronger resistance level is seen around 1.1615, marking the recent swing high.
3. Support Zone: Immediate support is found at 1.1524, which acts as the lower boundary of the consolidation range, followed by a stronger support level near 1.1442 as the key structural low.
4. Indicator Observation: Bollinger Bands are narrowing, signaling reduced volatility and consolidation. The Parabolic SAR shows mixed signals with frequent flips, while the MFI remains around mid-level, indicating balanced pressure. The MACD reflects weakening bullish momentum with a flattening signal line.
5. Technical Summary: EURUSD is currently in a consolidation phase following a bullish move, with no clear directional bias in the short term. Price is likely to continue ranging between key support and resistance levels unless a breakout occurs, supported by stronger momentum signals.
Market Performance:
Forex Last Price % Change
USD/JPY 159.17 −0.01%
GBP/USD 1.3333 −0.05%
Today’s Key Economic Calendar:
US: Chicago Fed National Activity Index
EU: Consumer Confidence Flash
EU: ECB Lane Speech
Risk Disclaimer: This report is for informational purposes only and does not constitute financial advice. Investments involve risks, and past performance does not guarantee future results. Consult your financial advisor for personalized investment strategies.
Tuyên bố miễn trừ trách nhiệm: Quan điểm được trình bày hoàn toàn là của tác giả và không đại diện cho quan điểm chính thức của Followme. Followme không chịu trách nhiệm về tính chính xác, đầy đủ hoặc độ tin cậy của thông tin được cung cấp và không chịu trách nhiệm cho bất kỳ hành động nào được thực hiện dựa trên nội dung, trừ khi được nêu rõ bằng văn bản.

Để lại tin nhắn của bạn ngay bây giờ