- AUD/JPY was seen trading around the 95.00 area ahead of the Asian session, posting a slight decline.
- After failing to sustain gains near 96.00, the pair retreated but remains above the 20-day SMA, keeping the outlook positive.
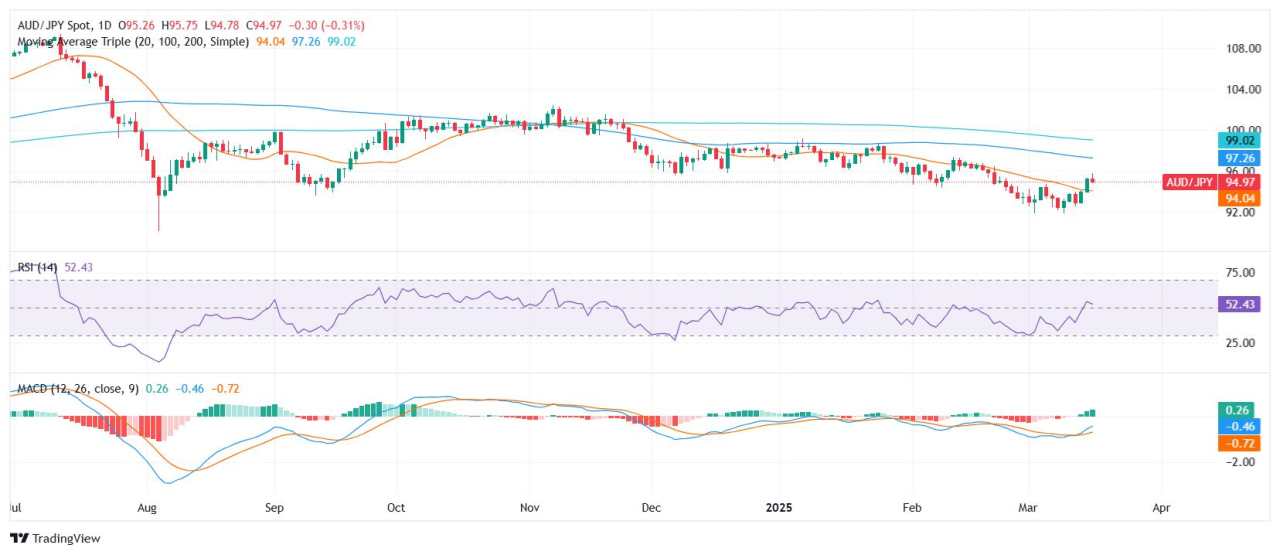
- Traders should monitor if the RSI crosses below 50, which could indicate a shift in momentum.
AUD/JPY edged lower on Tuesday ahead of the Asian session, retreating below 95.00 after hitting resistance near the 96.00 zone. Despite the pullback, the pair still holds above its 20-day Simple Moving Average (SMA), keeping the broader trend tilted to the upside.
Technically, the Relative Strength Index (RSI) has declined sharply but remains in positive territory at 54. A drop below the 50 mark could signal a potential shift in sentiment. Meanwhile, the Moving Average Convergence Divergence (MACD) continues to print rising green bars, suggesting that bullish momentum remains in place for now.
Looking ahead, immediate support lies at the 20-day SMA, while stronger demand may emerge near 94.50. On the upside, resistance is seen around 96.00, where sellers have consistently capped gains. If the pair manages to reclaim this level, further upside toward 97.00 could be in play.
AUD/JPY daily chart
Được in lại từ FXStreet, bản quyền được giữ lại bởi tác giả gốc.
Tuyên bố miễn trừ trách nhiệm: Quan điểm được trình bày hoàn toàn là của tác giả và không đại diện cho quan điểm chính thức của Followme. Followme không chịu trách nhiệm về tính chính xác, đầy đủ hoặc độ tin cậy của thông tin được cung cấp và không chịu trách nhiệm cho bất kỳ hành động nào được thực hiện dựa trên nội dung, trừ khi được nêu rõ bằng văn bản.

Để lại tin nhắn của bạn ngay bây giờ