- USD/CAD has dropped to a six-month low of 1.3833, aligning with the lower boundary of the descending channel.
- The 14-day RSI signals oversold conditions, suggesting the potential for an upward correction.
- Key resistance is seen at the nine-day Exponential Moving Average (EMA) at 1.4057.
The USD/CAD pair continues its losing streak for the fourth successive session, trading near 1.3840 during early European hours on Monday. Technical analysis on the daily chart indicates a prevailing bearish bias as the pair moves downward within the descending channel pattern.
However, the 14-day Relative Strength Index (RSI) has dropped below 30, confirming a bearish outlook while also indicating that the pair is in oversold territory. This suggests that upward corrections may occur in the near term. Additionally, the USD/CAD pair is trading below the nine-day Exponential Moving Average (EMA), pointing to weak short-term price momentum.
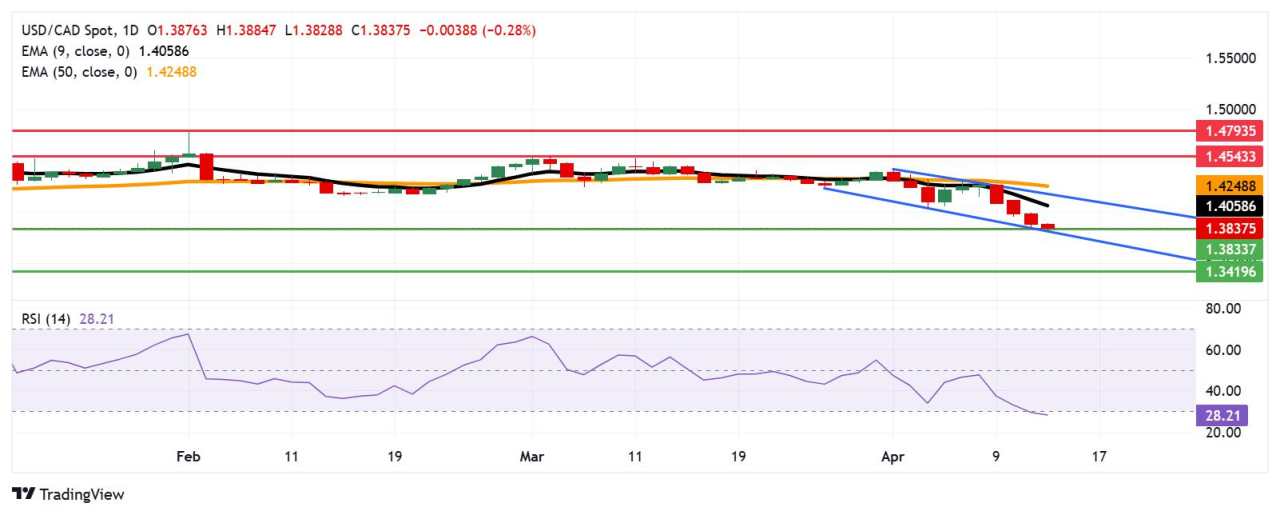
On the downside, the USD/CAD posted a fresh six-month low at 1.3833 earlier in the Asian session, which is aligned with the lower boundary of the descending channel at the 1.3810 level. A break below the descending channel could strengthen the bearish bias and lead the pair to navigate the region around the 1.3419 level, the lowest since February 2024.
The primary resistance appears at the nine-day EMA of 1.4057, followed by the descending channel’s upper boundary at the 1.4190 level. A break above the channel could cause the emergence of the bullish bias and lead the pair to test the 50-day EMA at the 1.4248 level. Further resistance level appears at the two-month high of 1.4543, recorded on March 4.
USD/CAD: Daily Chart
Canadian Dollar PRICE Today
The table below shows the percentage change of Canadian Dollar (CAD) against listed major currencies today. Canadian Dollar was the weakest against the New Zealand Dollar.
| USD | EUR | GBP | JPY | CAD | AUD | NZD | CHF | |
|---|---|---|---|---|---|---|---|---|
| USD | -0.29% | -0.71% | -0.76% | -0.20% | -0.65% | -1.02% | -0.20% | |
| EUR | 0.29% | 0.07% | 0.03% | 0.54% | 0.38% | -0.30% | 0.52% | |
| GBP | 0.71% | -0.07% | 0.34% | 0.46% | 0.31% | -0.36% | 0.46% | |
| JPY | 0.76% | -0.03% | -0.34% | 0.50% | -0.18% | -0.53% | 0.67% | |
| CAD | 0.20% | -0.54% | -0.46% | -0.50% | -0.41% | -0.82% | -0.08% | |
| AUD | 0.65% | -0.38% | -0.31% | 0.18% | 0.41% | -0.66% | 0.15% | |
| NZD | 1.02% | 0.30% | 0.36% | 0.53% | 0.82% | 0.66% | 0.84% | |
| CHF | 0.20% | -0.52% | -0.46% | -0.67% | 0.08% | -0.15% | -0.84% |
The heat map shows percentage changes of major currencies against each other. The base currency is picked from the left column, while the quote currency is picked from the top row. For example, if you pick the Canadian Dollar from the left column and move along the horizontal line to the US Dollar, the percentage change displayed in the box will represent CAD (base)/USD (quote).
Được in lại từ FXStreet_id, bản quyền được giữ lại bởi tác giả gốc.
Tuyên bố miễn trừ trách nhiệm: Quan điểm được trình bày hoàn toàn là của tác giả và không đại diện cho quan điểm chính thức của Followme. Followme không chịu trách nhiệm về tính chính xác, đầy đủ hoặc độ tin cậy của thông tin được cung cấp và không chịu trách nhiệm cho bất kỳ hành động nào được thực hiện dựa trên nội dung, trừ khi được nêu rõ bằng văn bản.


Tải thất bại ()