EUR/USD daily chart
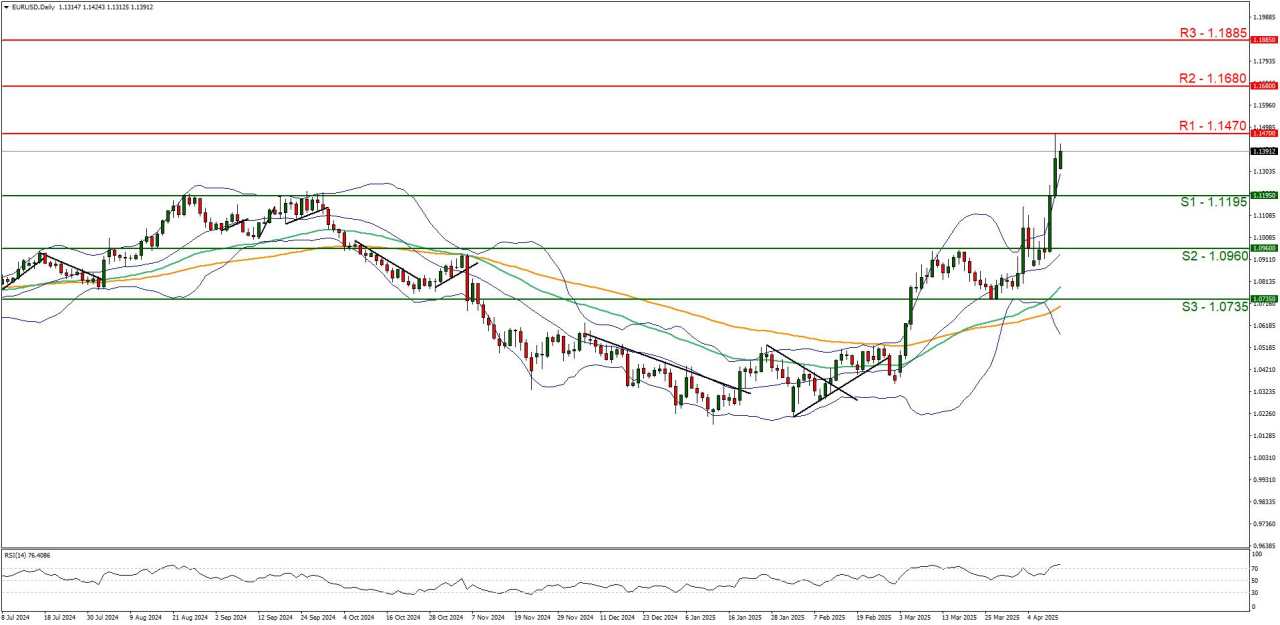
Support: 1.1195 (S1), 1.0960 (S2), 1.0735 (S3).
Resistance: 1.1470 (R1), 1.1680 (R2), 1.1885(R3).
EUR/USD appears to be moving in an upwards fashion, with the next possible target for the bulls being the 1.1470 (R1) resistance line. We opt for a bullish outlook for the pair and supporting our case is the RSI indicator below our chart which currently registers a figure above 70, implying a strong bullish market sentiment. Yet the RSI figure being above 70 may also imply that the pair is due a correction to lower ground. Nonetheless, for our bullish outlook to continue we would require a clear break above the 1.1470 (R1) resistance line with the next possible target for the bulls being the 1.1680 (R2) resistance level. On the flip side for a sideways bias we would require the pair to remain confined between the 1.1195 (S1) support level and the 1.1470 (R1) resistance line. Lastly, for a bearish outlook we would require a clear break below the 1.1195 (S1) support level with the next possible target for the bears being the 1.0960 (S2) support line.
GBP/USD daily chart

Support: 1.2945 (S1), 1.2715 (S2), 1.2505 (S3).
Resistance: 1.3200 (R1), 1.3415 (R2), 1.3640 (R3).
GBP/USD appears to be moving in an upwards fashion with the pair seemingly taking aim for our 1.3200 (R1) resistance level. We opt for a bullish outlook for the pair and supporting our case is the RSI indicator below our chart which currently registers a figure above 60, implying a bullish market sentiment. For our bullish outlook to continue we would require a clear break above the 1.3200 (R1) resistance line with the next possible target for the bulls being the 1.3415 (R2) resistance line. On the other hand, for a sideways bias we would require the pair to remain confined between the 1.2945 (S1) support level and the 1.3200 (R1) resistance line. Lastly, for a bearish outlook we would require a clear break below the 1.2945 (S1) support line with the next possible target for the bears being the 1.2715 (S2) support level.
XAU/USD daily chart
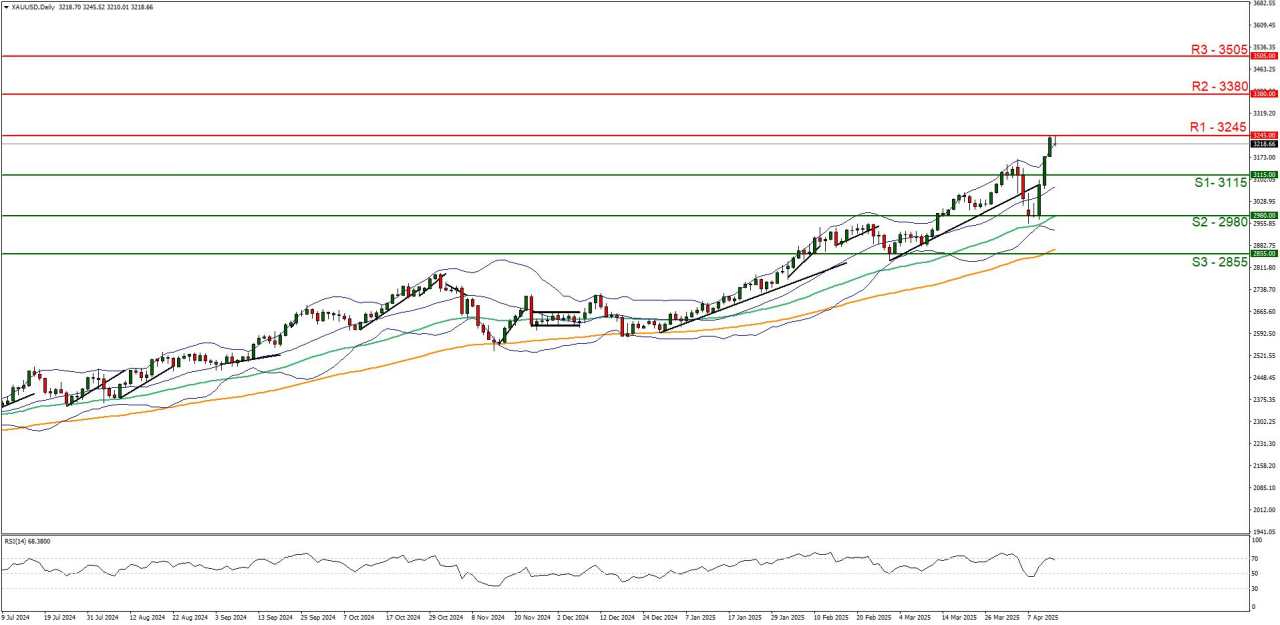
Support: 3115 (S1), 2980(S2), 2855 (S3).
Resistance: 3245 (R1), 3380 (R2), 3505 (R3).
XAU/USD appears to be moving in an upwards fashion, with gold’s price seemingly taking aim for its recently formed all-time-high figure near our 3245 (R1) resistance line. We opt for a bullish outlook for the precious metal’s price and supporting our case is the RSI indicator below our chart which currently registers a figure near 70, implying a strong bullish market sentiment. For our bullish outlook to continue we would require a break above the 3245 (R1) resistance level, with the next possible target for the bulls being the hypothetical 3380 (R2) resistance line. On the flip side for a sideways bias we would require gold’s price to remain confined between the 3115 (S1) support level and the 3245 (R1) resistance line. Lastly, for a bearish outlook we would require a break below the 3115 (S1) support level with the next possible target for the bears being the 2980 (S2) support line.
US500Cash daily chart
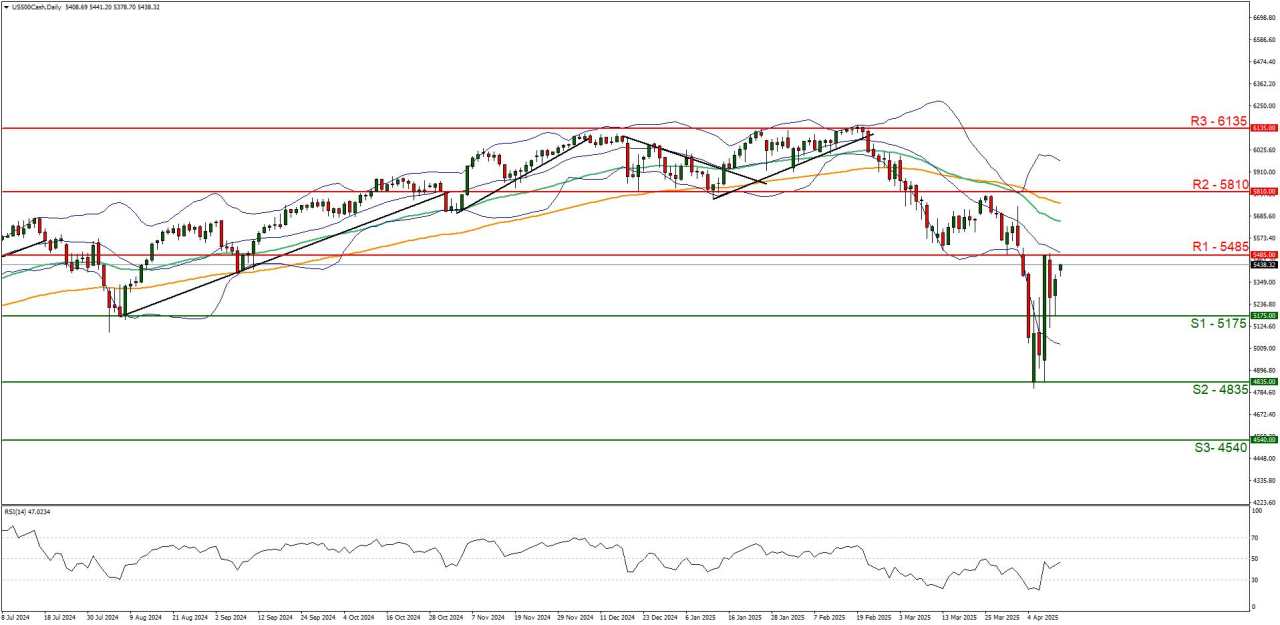
Support: 5175 (S1), 4835(S2), 4540 (S3).
Resistance: 5485 (R1), 5810 (R2), 6135(R3).
US500Cash appears to be recovering some ground following its dramatic fall. We would opt for a sideways bias for the index and supporting our case is the RSI indicator below our chart which currently registers a figure near 50, implying a neutral market sentiment. For our sideways bias to be maintained we would require the index to remain confined between the 5175 (S1) support level and the 5485 (R1) resistance line. However, we would opt for a bullish outlook for the index in the event of a clear break above the 5485 (R1) resistance line, with the next possible target for the bulls being the 5810 (R2) resistance level. Lastly, for a bearish outlook we would require a clear break below the 5175 (S1) support level with the next possible target for the bears being the 4835 (S2) support line.
Được in lại từ FXStreet, bản quyền được giữ lại bởi tác giả gốc.
Tuyên bố miễn trừ trách nhiệm: Quan điểm được trình bày hoàn toàn là của tác giả và không đại diện cho quan điểm chính thức của Followme. Followme không chịu trách nhiệm về tính chính xác, đầy đủ hoặc độ tin cậy của thông tin được cung cấp và không chịu trách nhiệm cho bất kỳ hành động nào được thực hiện dựa trên nội dung, trừ khi được nêu rõ bằng văn bản.


Để lại tin nhắn của bạn ngay bây giờ