- USD/JPY trades near the 143 zone, extending mild gains ahead of the Asian session
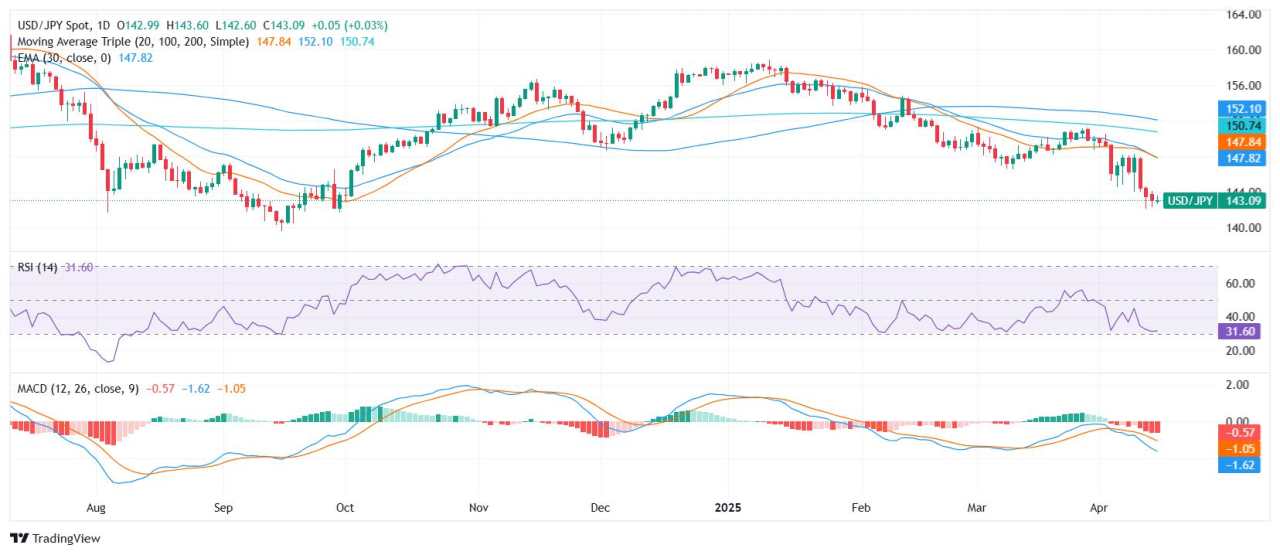
- Despite the uptick, technical indicators and moving averages continue to reflect a bearish structure
- Support sits at 142.41, while resistance levels cap gains near 145.79 and 146.62
The USD/JPY pair saw a slight rise on Tuesday, hovering around the 143 area as it edged higher within its daily range. The modest intraday rebound comes ahead of the Asian session but has yet to challenge the broader bearish signals dominating the chart.
Technical indicators remain conflicted. The Relative Strength Index is neutral at 32.19, holding near the lower bound without triggering oversold conditions. Meanwhile, the MACD continues to print a bearish crossover, reinforcing downside pressure. A contrasting view comes from the Williams Percent Range at -88.24, which suggests the pair may be oversold in the short term and due for a bounce. The Ultimate Oscillator at 52.72 remains neutral, offering no clear bias.
The dominant trend remains negative, especially when analyzing moving averages. The 10-day exponential and simple moving averages at 145.47 and 145.79, respectively, cap near-term upside. Longer-term averages—20-day at 147.81, 100-day at 152.02, and 200-day at 150.77—continue to slope downward, affirming persistent selling pressure.
Daily chart
Được in lại từ FXStreet_id, bản quyền được giữ lại bởi tác giả gốc.
Tuyên bố miễn trừ trách nhiệm: Quan điểm được trình bày hoàn toàn là của tác giả và không đại diện cho quan điểm chính thức của Followme. Followme không chịu trách nhiệm về tính chính xác, đầy đủ hoặc độ tin cậy của thông tin được cung cấp và không chịu trách nhiệm cho bất kỳ hành động nào được thực hiện dựa trên nội dung, trừ khi được nêu rõ bằng văn bản.


Tải thất bại ()