- NZD/USD could challenge the key resistance level at 0.6038, the highest point in six months.
- Technical indicators suggest prevailing short-term bullish momentum.
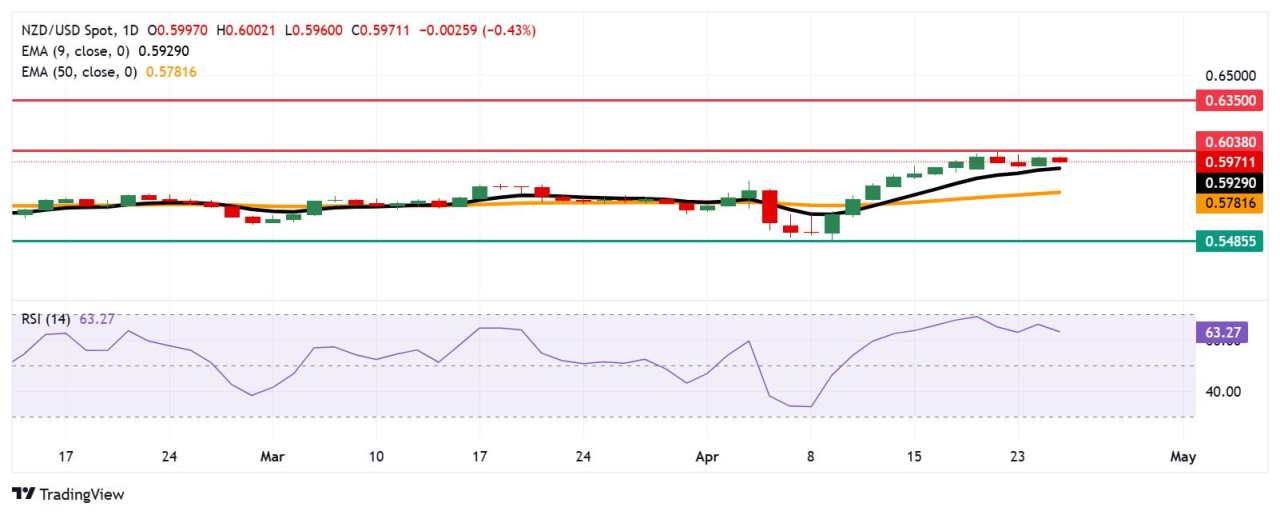
- Initial support is found at the nine-day EMA, currently at 0.5929.
The NZD/USD pair offers its recent gains registered in the previous session, trading around 0.5960 during early European trading hours on Friday.
Technical indicators on the daily chart suggest a bullish bias, with the pair remaining above the nine-day Exponential Moving Average (EMA), signaling improved short-term price momentum.
Moreover, the 14-day Relative Strength Index (RSI) is positioned above the 50 mark, suggesting the prevailing bullish bias.
A rebound toward to the 70 mark could reinforce the market sentiment to test six-month high of 0.6038, last seen in November 2024.
A sustained break above six-month high could open the doors to explore the area around its seven-month high near 0.6350, recorded in October 2024.
The initial support is located at the nine-day EMA at 0.5929. A break below this level could weaken the short-term bullish momentum and open the door for further downside toward the 50-day EMA at 0.5781.
Further depreciation would deepen the bearish bias and put the downward pressure on the NZD/USD pair to test support at 0.5485—a level not visited since March 2020.
NZD/USD: Daily Chart
New Zealand Dollar PRICE Today
The table below shows the percentage change of New Zealand Dollar (NZD) against listed major currencies today. New Zealand Dollar was the weakest against the US Dollar.
| USD | EUR | GBP | JPY | CAD | AUD | NZD | CHF | |
|---|---|---|---|---|---|---|---|---|
| USD | 0.37% | 0.28% | 0.65% | 0.12% | 0.08% | 0.41% | 0.62% | |
| EUR | -0.37% | -0.10% | 0.29% | -0.27% | -0.30% | 0.05% | 0.24% | |
| GBP | -0.28% | 0.10% | 0.38% | -0.16% | -0.19% | 0.13% | 0.31% | |
| JPY | -0.65% | -0.29% | -0.38% | -0.50% | -0.57% | -0.25% | -0.06% | |
| CAD | -0.12% | 0.27% | 0.16% | 0.50% | -0.13% | 0.30% | 0.47% | |
| AUD | -0.08% | 0.30% | 0.19% | 0.57% | 0.13% | 0.35% | 0.52% | |
| NZD | -0.41% | -0.05% | -0.13% | 0.25% | -0.30% | -0.35% | 0.17% | |
| CHF | -0.62% | -0.24% | -0.31% | 0.06% | -0.47% | -0.52% | -0.17% |
The heat map shows percentage changes of major currencies against each other. The base currency is picked from the left column, while the quote currency is picked from the top row. For example, if you pick the New Zealand Dollar from the left column and move along the horizontal line to the US Dollar, the percentage change displayed in the box will represent NZD (base)/USD (quote).
Được in lại từ FXStreet_id, bản quyền được giữ lại bởi tác giả gốc.
Tuyên bố miễn trừ trách nhiệm: Quan điểm được trình bày hoàn toàn là của tác giả và không đại diện cho quan điểm chính thức của Followme. Followme không chịu trách nhiệm về tính chính xác, đầy đủ hoặc độ tin cậy của thông tin được cung cấp và không chịu trách nhiệm cho bất kỳ hành động nào được thực hiện dựa trên nội dung, trừ khi được nêu rõ bằng văn bản.


Tải thất bại ()