Remember that time you placed the “perfect” trade based on last quarter’s GDP, only to get blindsided when the market had already priced in completely different expectations?
Here’s the brutal truth about fundamental analysis in forex:
By the time those official GDP numbers hit the news, they’re already outdated.
Markets have moved on, currencies have shifted, and that potentially profitable trade? Gone with the wind. 💨
But don’t worry! There’s a not-so-secret weapon that savvy traders use to get ahead: “nowcasting” tools.
Think of them as economic crystal balls that give you insights into GDP growth before the official numbers drop.
What’s Nowcasting? 🤔

Imagine you’re trying to figure out if the U.S. economy is doing well today.
Official GDP data won’t arrive for weeks! And when it does, you might get three conflicting revisions over months, all measuring a quarter that already ended. By the time we get the ‘final’ numbers, the economy has already moved on.
Nowcasting tools are like economic crystal balls that use currently available data to estimate what GDP growth looks like right this minute.
In this economic showdown, we’ll look at three major players in the nowcasting game:
- Atlanta Fed’s GDPNow
- St. Louis Fed’s Nowcast
- New York Fed’s Nowcast
Atlanta Fed’s GDPNow
Here’s what it looks like:
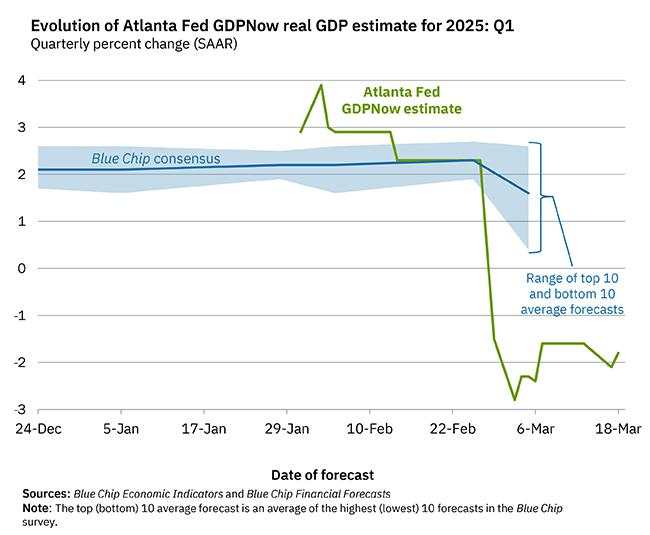
What It Is and How It Works
GDPNow is basically trying to replicate the government’s own GDP calculation method, but in real-time.
It takes the same 13 components the Bureau of Economic Analysis (BEA) uses to calculate GDP and estimates them based on the latest economic releases.
The Bureau of Economic Analysis (BEA) is a U.S. government agency that provides official macroeconomic statistics, with GDP being one of its most important releases.
Think of it like following a recipe to the letter. If the BEA makes GDP with 13 specific ingredients, GDPNow uses the same recipe but with preliminary ingredients that are available right now.
The Good Stuff
- Super timely: Updates about 6-7 times a month as new data drops.
- Plays by the rules: Follows the BEA’s methods closely, so it’s like getting a preview of the “official” number.
- No human opinions: Just cold, hard data—no economists saying “well, I feel like…”
- Gets more accurate: As the quarter progresses and more data comes in, it gets better at guessing.
The Not-So-Good Stuff
- Early volatility: This can swing wildly at the beginning of a quarter when data is limited (like trying to guess a movie’s plot from just the opening scene).
- Sometimes optimistic: Has a tendency to overestimate actual GDP.
- Data limitations: Can be thrown off by unusual data points (like that time a surge in gold imports temporarily tanked the estimate).
Track Record
Since 2011, GDPNow’s final forecasts have been off by about 0.77 percentage points on average. Not perfect, but not bad for predicting the future!
St. Louis Fed’s Nowcast
Here’s what it looks like:
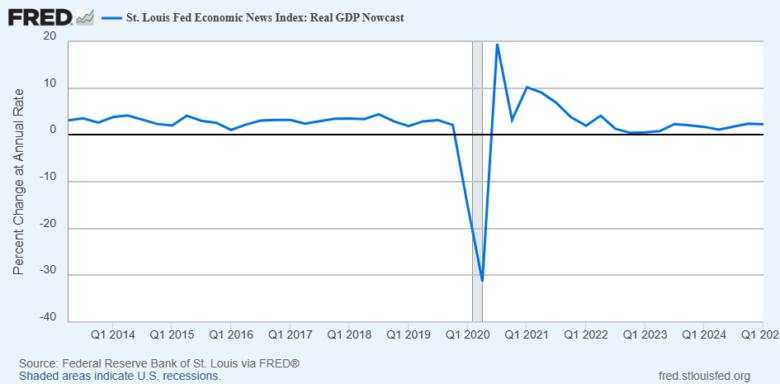
What It Is and How It Works
This nowcast doesn’t just stick to the BEA’s recipe. It uses a “dynamic factor model” (fancy statistical term alert!) that incorporates a wider range of economic data, even stuff the BEA doesn’t use for GDP.
A dynamic factor model is an advanced statistical technique that looks for common patterns or “factors” that influence many different economic variables at once.
It also features something called the Economic News Index (ENI), which weighs economic data based on how good they are at predicting GDP growth.
The Good Stuff
- Stability: Less roller-coaster-like early in the quarter.
- Broader view: Looks beyond just GDP components for a more comprehensive picture.
- Trend spotter: Changes in its forecast can signal shifting economic winds.
- Recession detector: Might be better at spotting downturns before they’re obvious.
The Not-So-Good Stuff
- Less accurate at the finish line: Final estimates tend to be further off than GDPNow.
- Underestimation issues: Has recently been underestimating GDP growth.
- No component forecasts: Doesn’t break down GDP into its parts.
- Black box vibes: Not as transparent about exactly how it works.
Track Record
Since 2022, it’s been underestimating GDP by about 1.02% on average. Before the pandemic, it was typically overestimating by about 0.5%.
New York Fed Nowcast
Here’s what it looks like:
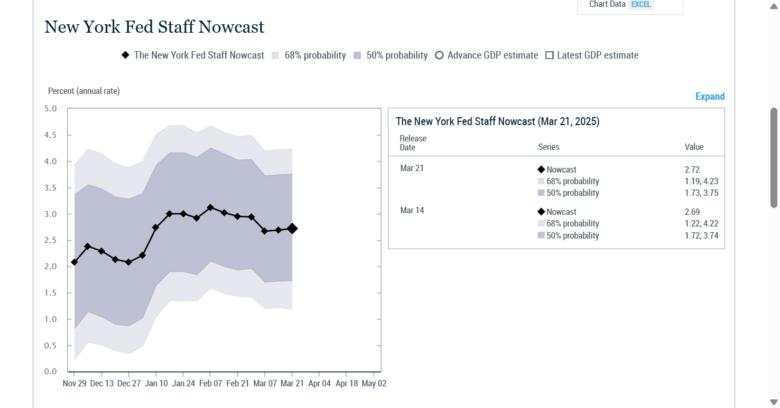
What It Is and How It Works
This nowcast also uses a dynamic factor model but adds Bayesian estimation and Kalman filtering techniques. If that sounds like statistics professor jargon, you’re right!
It was rebooted in 2023 with upgrades to handle economic volatility better (thanks, COVID). It looks at various “latent factors” like global trends, soft data, labor markets, and more.
The Good Stuff
- Handles chaos well: Better equipped for volatile economic periods.
- Uncertainty ranges: Shows prediction as a range of possible values (probability bands) rather than just one number.
- Complex relationships: Captures how different economic variables interact.
- Crisis detector: Good at signaling when things might go south.
The Not-So-Good Stuff
- COVID casualty: The original model was suspended during the pandemic (it basically threw up its hands and said “I can’t with this”).
- Data-dependent: Needs lots of quality data to work properly.
- Complex methodology: Not exactly easy to explain to your friends at dinner.
- Limited long-term data: The new version doesn’t have years of track record yet.
Track Record
One study found it had an average error of 0.9%, placing it between GDPNow (0.6%) and the St. Louis Fed Nowcast (1.1%) in accuracy. It seems to perform better during recessions than during good times.
Which One Should You Trust? 🤷♀️
Here’s the deal: there’s no single “best” nowcasting tool. Each has its own superpowers and kryptonite.
For tracking what the official GDP number will be: → GDPNow is your best bet, especially late in the quarter
For a steadier early view of the economy: → St. Louis Fed’s Nowcast offers more stability when data is limited
For understanding the range of possible outcomes: → New York Fed Nowcast provides those handy probability intervals
For maximum economic insight: → Use all three! Economic forecasting is like checking the weather—you don’t just look at one app, right?
The Bottom Line 💡
Here’s a summary comparing the three nowcasting tools:
| Feature | Atlanta Fed’s GDPNow | St. Louis Fed’s Nowcast (ENI) | New York Fed Nowcast |
| Methodology | Bridge equation (BEA-like) | Dynamic factor model, ENI | Dynamic factor model, Bayesian/Kalman |
| Data Input | BEA GDP subcomponents, monthly data | Broad economic data (incl. non-BEA) | Broad macroeconomic data |
| Transparency | High | Moderate | Moderate |
| Volatility (Early) | High | Lower | – |
| Final Accuracy | Generally high | Lower than GDPNow | Variable |
| Component Forecasts | Yes | No | No |
| Uncertainty Measure | No | No | Probability intervals |
| Recent Bias | Underestimation | Underestimation | – |
Nowcasting tools aren’t perfect crystal balls, but they give us a way to peek at the economy in real-time instead of constantly looking in the rearview mirror.
Remember the First Rule of Economic Forecasting: All models are wrong, but some are useful. These tools give us useful insights, even with their limitations.
So next time someone asks, “How’s the economy doing right now?”—you can point to these nowcasts and say, “Well, according to my economic crystal balls…”
Happy forecasting! 📈🔮💰


Tải thất bại ()