- GBP/JPY retreats after hitting 196.39, forming bearish engulfing candle suggesting downside risk.
- Break below 194.22 could open path toward 193.31 Tenkan-sen and 200-day SMA at 192.32.
- Bulls need to reclaim 195.00 to retest resistance at 196.00 and May high of 196.39.
The GBP/JPY retreated on Wednesday, losing over 0.82% after hitting a weekly high of 196.39 earlier during the Asian session. As Thursday's Asian session begins, the GBP/JPY trades at 194.48 flat.
GBP/JPY Price Forecast: Technical outlook
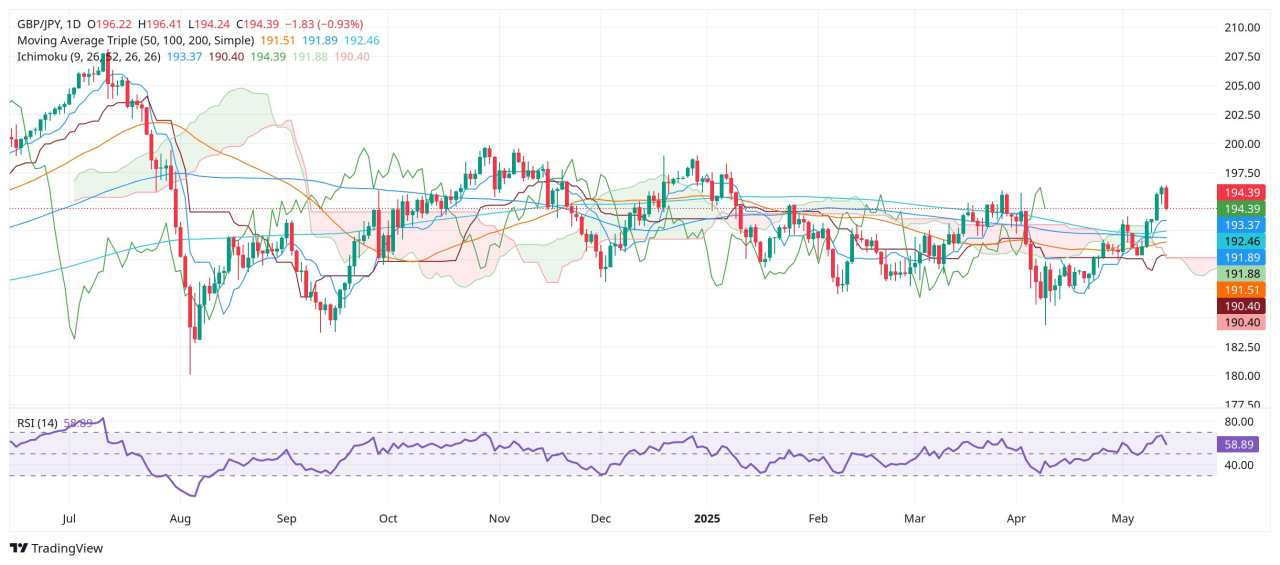
Despite retreating, the uptrend on the GBP/JPY remains intact. However, a pullback is on the cards after forming a ‘bearish engulfing’ candle chart pattern that could send the pair drifting lower. Still, a break below the May 14 low of 194.22 is required for further confirmation that the pair is extending its losses.
In that outcome, the next support would be the Tenkan.sen at 193.31, ahead of the 200-day Simple Moving Average (SMA) at 192.32.
Conversely, if GBP/JPY reverses its course and buyers reclaim 195.00, the next resistance would be the 196.00 figure, followed by the May 14 peak of 196.39. Further gains are seen if the latter is cleared, with 197.00 emerging as the next potential ceiling level.
GBP/JPY Price Chart – Daily
British Pound PRICE This week
The table below shows the percentage change of British Pound (GBP) against listed major currencies this week. British Pound was the strongest against the Swiss Franc.
| USD | EUR | GBP | JPY | CAD | AUD | NZD | CHF | |
|---|---|---|---|---|---|---|---|---|
| USD | 0.55% | 0.31% | 0.18% | 0.55% | -0.18% | 0.47% | 0.75% | |
| EUR | -0.55% | -0.12% | 0.16% | 0.48% | -0.11% | 0.40% | 0.69% | |
| GBP | -0.31% | 0.12% | 0.47% | 0.60% | 0.02% | 0.44% | 0.81% | |
| JPY | -0.18% | -0.16% | -0.47% | 0.38% | -0.97% | -0.56% | 0.36% | |
| CAD | -0.55% | -0.48% | -0.60% | -0.38% | -0.45% | -0.08% | 0.21% | |
| AUD | 0.18% | 0.11% | -0.02% | 0.97% | 0.45% | 0.41% | 0.77% | |
| NZD | -0.47% | -0.40% | -0.44% | 0.56% | 0.08% | -0.41% | 0.27% | |
| CHF | -0.75% | -0.69% | -0.81% | -0.36% | -0.21% | -0.77% | -0.27% |
The heat map shows percentage changes of major currencies against each other. The base currency is picked from the left column, while the quote currency is picked from the top row. For example, if you pick the British Pound from the left column and move along the horizontal line to the US Dollar, the percentage change displayed in the box will represent GBP (base)/USD (quote).
Được in lại từ FXStreet_id, bản quyền được giữ lại bởi tác giả gốc.
Tuyên bố miễn trừ trách nhiệm: Quan điểm được trình bày hoàn toàn là của tác giả và không đại diện cho quan điểm chính thức của Followme. Followme không chịu trách nhiệm về tính chính xác, đầy đủ hoặc độ tin cậy của thông tin được cung cấp và không chịu trách nhiệm cho bất kỳ hành động nào được thực hiện dựa trên nội dung, trừ khi được nêu rõ bằng văn bản.


Tải thất bại ()