- XAG/USD rebounds to $32.50 on Tuesday after holding firm above the key $32.00 support.
- DXY hits fresh weekly low after Moody’s downgrade and growing US fiscal concerns.
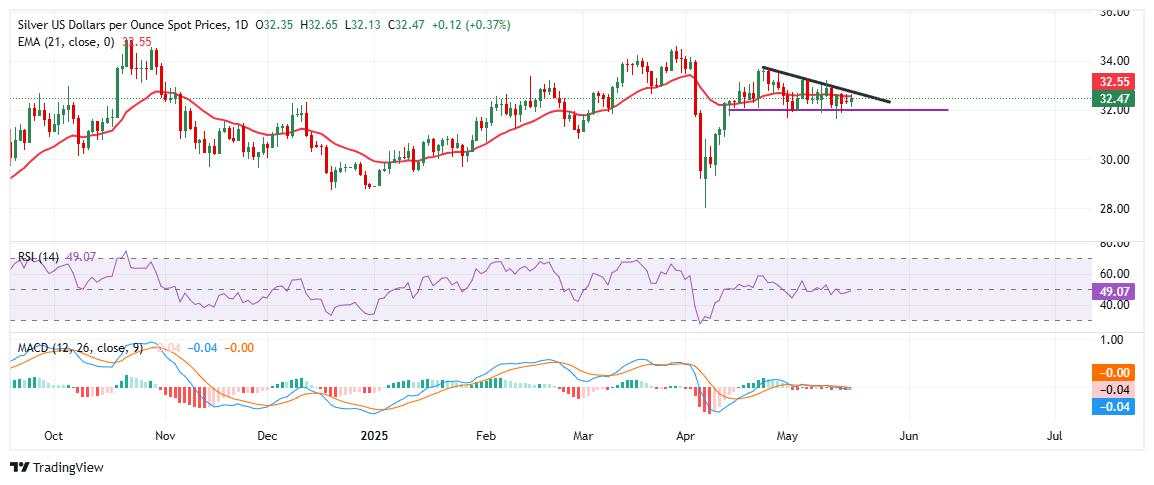
- The price hovers around the 21-day (EMA) as a symmetrical triangle pattern tightens, signaling a potential breakout in the near term.
Silver (XAG/USD) is trading higher around $32.60 on Tuesday, recovering from intraday lows near $32.13 as the metal regains traction after two straight days of losses. Although it appears to be range-bound, the rebound is supported by a softer US Dollar (USD) and steady investor demand for industrial metals, even as easing geopolitical tensions boost broader investor confidence.
Silver’s safe-haven demand had softened in recent sessions amid signs of geopolitical de-escalation and improving global risk sentiment. Reports that Russia and Ukraine are exploring ceasefire talks have boosted market optimism, while a temporary tariff truce between the US and China further eased global trade tensions. Still, Silver continues to find longer-term support from robust industrial demand. Forecasts from the Silver Institute projects industrial usage will top 700 million ounces in 2025, driven by rising demand from electric vehicles, solar panels, and electronics.
Meanwhile, the US Dollar Index (DXY) retreats near the 100.00 mark, marking a fresh weekly low on Tuesday, as sentiment weakened following Moody’s downgrade of the US credit rating from Aaa to Aa1. The move was driven by rising concerns over ballooning US government debt and an expanding budget deficit. The fiscal outlook has reignited bullishness among bond investors and pressured the Greenback, offering some relief to US Dollar-denominated commodities like Silver.
Technically, Silver is consolidating within a symmetrical triangle pattern, with price action compressing between horizontal support near the $32.00 psychological level and descending trendline resistance from the April highs. The 21-day Exponential Moving Average (EMA) at $32.56 is acting as an immediate resistance on the upside, followed by the $33.00 level near the previous week's high. The Relative Strength Index (RSI) sits around the neutral 50 level, while Moving Average Convergence Divergence (MACD) lines are showing early signs of a bullish crossover.
A decisive move above $33.00 would confirm a breakout, opening the door toward the $34.00 resistance zone. On the downside, sustained pressure below $32.00 could expose the $31.00–$30.75 region.
Được in lại từ FXStreet_id, bản quyền được giữ lại bởi tác giả gốc.
Tuyên bố miễn trừ trách nhiệm: Quan điểm được trình bày hoàn toàn là của tác giả và không đại diện cho quan điểm chính thức của Followme. Followme không chịu trách nhiệm về tính chính xác, đầy đủ hoặc độ tin cậy của thông tin được cung cấp và không chịu trách nhiệm cho bất kỳ hành động nào được thực hiện dựa trên nội dung, trừ khi được nêu rõ bằng văn bản.


Tải thất bại ()