- NZD/USD could target the upper side of the rectangle around 0.6010.
- A bullish bias strengthens as the 14-day Relative Strength Index remains above the 50 mark.
- The primary support appears at the nine-day EMA of 0.5916.
NZD/USD is trading around 0.5940 during the European hours on Wednesday. The pair has retraced its recent losses registered in the previous session as a neutral bias persists, suggested by the technical analysis of the daily chart showing the pair is consolidating within a rectangular pattern.
A bullish bias is expected to be reinforced as the 14-day Relative Strength Index (RSI) remains slightly above the 50 mark. Meanwhile, the NZD/USD pair is positioned above the nine-day Exponential Moving Average (EMA), indicating a short-term price momentum is stronger.
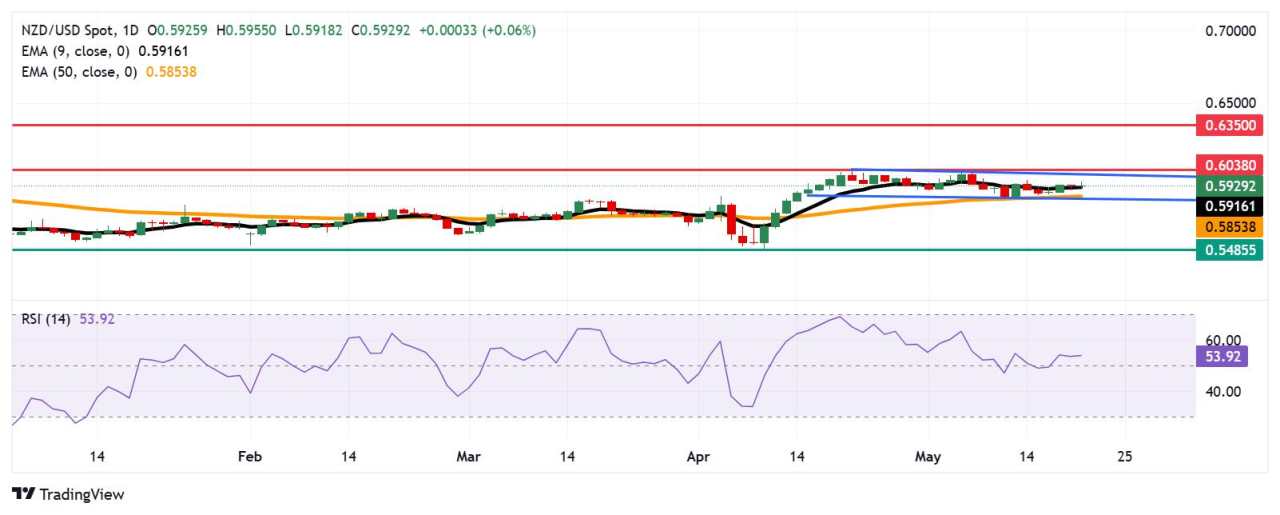
The NZD/USD pair may aim for the upper boundary of the rectangle around 0.6010. A further barrier appears at the six-month high of 0.6038, which was last reached in November 2024. A decisive break above this key resistance level could open the doors for a move toward the seven-month high around 0.6350, reached in October 2024.
The NZD/USD pair could test the initial support at the nine-day EMA of 0.5916 on the downside. Further depreciation below this level would weaken the short-term price momentum and potentially drive the pair toward the 50-day EMA at 0.5853. Further decline would encounter the rectangle’s lower boundary around 0.5830. A sustained move beneath this crucial support zone could further dampen medium-term price momentum, paving the way for a deeper decline toward 0.5485, a level not seen since March 2020.
NZD/USD: Daily Chart
New Zealand Dollar PRICE Today
The table below shows the percentage change of New Zealand Dollar (NZD) against listed major currencies today. New Zealand Dollar was the strongest against the US Dollar.
| USD | EUR | GBP | JPY | CAD | AUD | NZD | CHF | |
|---|---|---|---|---|---|---|---|---|
| USD | -0.38% | -0.14% | -0.27% | -0.20% | -0.30% | -0.10% | -0.42% | |
| EUR | 0.38% | 0.25% | 0.07% | 0.16% | 0.10% | 0.29% | -0.04% | |
| GBP | 0.14% | -0.25% | -0.14% | -0.07% | -0.15% | 0.05% | -0.30% | |
| JPY | 0.27% | -0.07% | 0.14% | 0.08% | -0.01% | 0.18% | -0.14% | |
| CAD | 0.20% | -0.16% | 0.07% | -0.08% | -0.10% | 0.12% | -0.23% | |
| AUD | 0.30% | -0.10% | 0.15% | 0.01% | 0.10% | 0.20% | -0.13% | |
| NZD | 0.10% | -0.29% | -0.05% | -0.18% | -0.12% | -0.20% | -0.33% | |
| CHF | 0.42% | 0.04% | 0.30% | 0.14% | 0.23% | 0.13% | 0.33% |
The heat map shows percentage changes of major currencies against each other. The base currency is picked from the left column, while the quote currency is picked from the top row. For example, if you pick the New Zealand Dollar from the left column and move along the horizontal line to the US Dollar, the percentage change displayed in the box will represent NZD (base)/USD (quote).
Được in lại từ FXStreet_id, bản quyền được giữ lại bởi tác giả gốc.
Tuyên bố miễn trừ trách nhiệm: Quan điểm được trình bày hoàn toàn là của tác giả và không đại diện cho quan điểm chính thức của Followme. Followme không chịu trách nhiệm về tính chính xác, đầy đủ hoặc độ tin cậy của thông tin được cung cấp và không chịu trách nhiệm cho bất kỳ hành động nào được thực hiện dựa trên nội dung, trừ khi được nêu rõ bằng văn bản.


Tải thất bại ()