- Franc surges nearly 1% as Trump’s tariff threats trigger risk aversion and deepen the Dollar’s slide.
- USD/CHF breaks below 0.8250, nearing key support at May’s low of 0.8184.
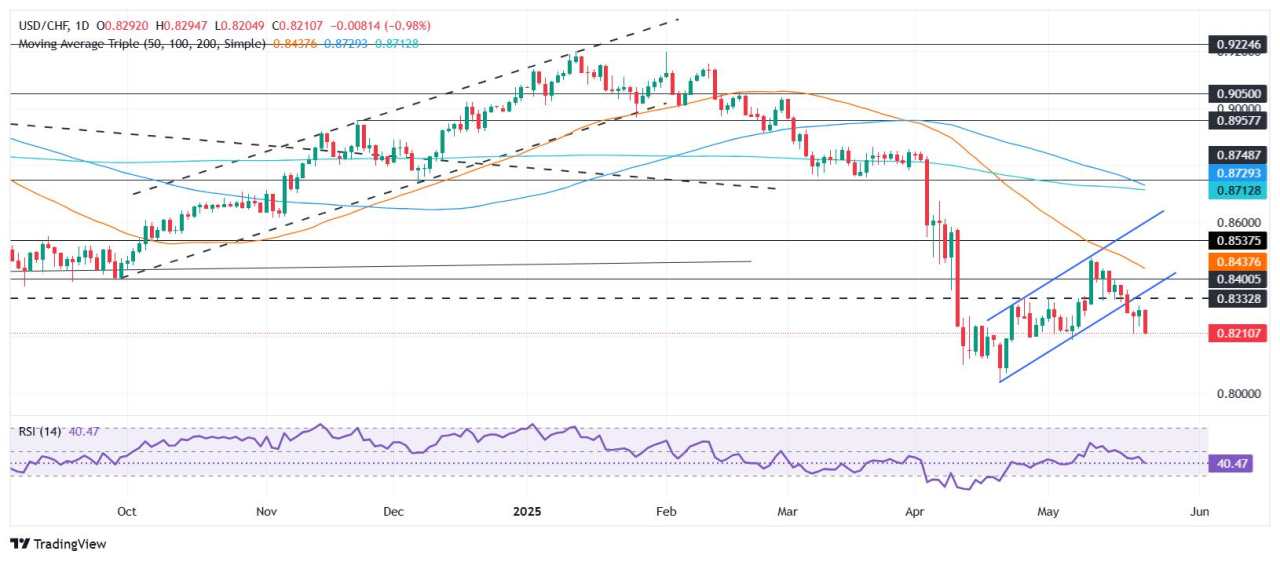
- Bearish flag breakdown points to possible test of 2025 low at 0.8038.
- Traders pile into Swiss Franc as US protectionism and fiscal risks spook markets.
USD/CHF continues to weaken as the downtrend extends past 0.8250 as the pair losses almost 1%. Investors seeking safety bought the Swiss Franc after US President Donald Trump threatened to enact tariffs of 50% on Europe and 25% on Apple’s iPhone manufactured overseas. At the time of writing, the pair trades at 0.8203, at new two-week lows.
USD/CHF Price Forecast: Technical outlook
As of writing, the USD/CHF is tilted to the downside after clearing the bottom fo a ‘bearish flag’ pattern, which indicates that the pair might test the current year-to-date (YTD) low of 0.8038.
Momentum favors further downside, as USD/CHF has achieved a successive series of lower highs and lower lows, with the Relative Strength Index (RSI) remaining in bearish territory.
On its way towards the YTD low, the USD/CHF must drop below 0.8200. A breach of the latter will expose May’s low of 0.8184, followed by 0.8100 and the 0.8050 mark.
On the upside, buyers need to clear the May 22 peak of 0.8396, ahead of the 0.8350 and 0.8400.
USD/CHF Price Chart – Daily
Swiss Franc PRICE This week
The table below shows the percentage change of Swiss Franc (CHF) against listed major currencies this week. Swiss Franc was the strongest against the US Dollar.
| USD | EUR | GBP | JPY | CAD | AUD | NZD | CHF | |
|---|---|---|---|---|---|---|---|---|
| USD | -1.58% | -1.84% | -1.90% | -1.78% | -1.42% | -1.72% | -1.86% | |
| EUR | 1.58% | -0.29% | -0.28% | -0.14% | 0.29% | -0.08% | -0.28% | |
| GBP | 1.84% | 0.29% | -0.27% | 0.15% | 0.58% | 0.21% | 0.00% | |
| JPY | 1.90% | 0.28% | 0.27% | 0.13% | 0.65% | 0.38% | 0.09% | |
| CAD | 1.78% | 0.14% | -0.15% | -0.13% | 0.37% | 0.06% | -0.14% | |
| AUD | 1.42% | -0.29% | -0.58% | -0.65% | -0.37% | -0.37% | -0.56% | |
| NZD | 1.72% | 0.08% | -0.21% | -0.38% | -0.06% | 0.37% | -0.20% | |
| CHF | 1.86% | 0.28% | -0.01% | -0.09% | 0.14% | 0.56% | 0.20% |
The heat map shows percentage changes of major currencies against each other. The base currency is picked from the left column, while the quote currency is picked from the top row. For example, if you pick the Swiss Franc from the left column and move along the horizontal line to the US Dollar, the percentage change displayed in the box will represent CHF (base)/USD (quote).
Được in lại từ FXStreet, bản quyền được giữ lại bởi tác giả gốc.
Tuyên bố miễn trừ trách nhiệm: Nội dung trên chỉ đại diện cho quan điểm của tác giả hoặc khách mời. Nó không đại diện cho quan điểm hoặc lập trường của FOLLOWME và không có nghĩa là FOLLOWME đồng ý với tuyên bố hoặc mô tả của họ, cũng không cấu thành bất kỳ lời khuyên đầu tư nào. Đối với tất cả các hành động do khách truy cập thực hiện dựa trên thông tin do cộng đồng FOLLOWME cung cấp, cộng đồng không chịu bất kỳ hình thức trách nhiệm nào trừ khi có cam kết rõ ràng bằng văn bản.
Website Cộng đồng Giao Dịch FOLLOWME: www.followme.asia


Tải thất bại ()