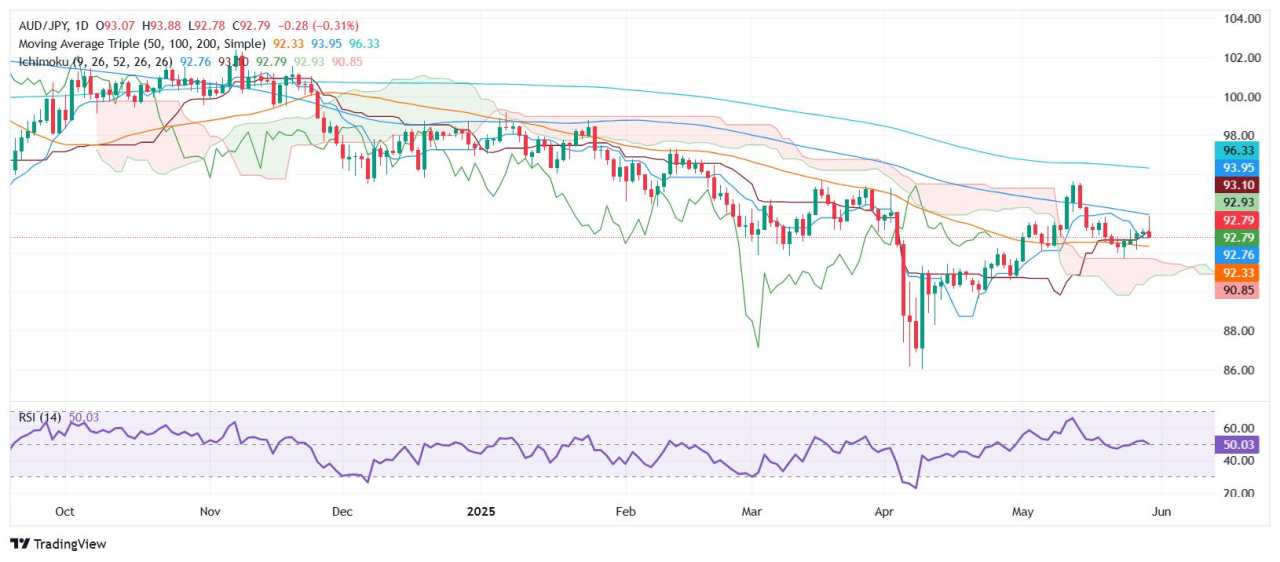
- AUD/JPY retreats as risk-off sentiment lifts Yen; closes below key 93.00 threshold.
- Break below Tenkan-sen at 92.75 could open path toward support at 91.50 and 90.81.
- Bulls need to reclaim 93.86 to challenge 94.00 and resume upward momentum.
AUD/JPY loses some ground on Thursday ahead of the beginning of Friday’s Asian session, falls over 0.19%, below the 93.00 figure, yet retains its sideways bias as the cross pair remains above the Ichimoku Cloud (Kumo).
AUD/JPY Price Forecast: Technical outlook
The AUD/JPY reached a two-week high of 93.86 on Thursday, but as market participants turned risk-averse, Yen’s strength sent the cross drifting lower and finished the day with losses. Additionally, the daily close below 93.00 has opened the path for lower prices.
If AUD/JPY drops below the Tenkan-sen of 92.75, the next support would be a May 27 low of 92.12. Once surpassed, the next key support levels would be the May 23 swing low of 91.63, the top of the Ichimoku cloud (Kumo) at 91.50, and the Senkou Span B at 90.81.
For a bullish reversal, buyers need to climb past 93.00 and break stir resistance at 93.86, the May 29 high. Once surpassed, the 94.00 figure would be up for grabs.
AUD/JPY Price Chart – Daily
Australian Dollar PRICE This week
The table below shows the percentage change of Australian Dollar (AUD) against listed major currencies this week. Australian Dollar was the strongest against the Japanese Yen.
| USD | EUR | GBP | JPY | CAD | AUD | NZD | CHF | |
|---|---|---|---|---|---|---|---|---|
| USD | -0.05% | 0.22% | 1.02% | 0.53% | 0.69% | 0.19% | 0.17% | |
| EUR | 0.05% | 0.27% | 1.10% | 0.58% | 0.74% | 0.24% | 0.23% | |
| GBP | -0.22% | -0.27% | 0.51% | 0.30% | 0.46% | -0.03% | -0.03% | |
| JPY | -1.02% | -1.10% | -0.51% | -0.48% | -0.34% | -0.88% | -0.85% | |
| CAD | -0.53% | -0.58% | -0.30% | 0.48% | 0.17% | -0.33% | -0.33% | |
| AUD | -0.69% | -0.74% | -0.46% | 0.34% | -0.17% | -0.53% | -0.49% | |
| NZD | -0.19% | -0.24% | 0.03% | 0.88% | 0.33% | 0.53% | -0.00% | |
| CHF | -0.17% | -0.23% | 0.03% | 0.85% | 0.33% | 0.49% | 0.00% |
The heat map shows percentage changes of major currencies against each other. The base currency is picked from the left column, while the quote currency is picked from the top row. For example, if you pick the Australian Dollar from the left column and move along the horizontal line to the US Dollar, the percentage change displayed in the box will represent AUD (base)/USD (quote).
Được in lại từ FXStreet, bản quyền được giữ lại bởi tác giả gốc.
Tuyên bố miễn trừ trách nhiệm: Nội dung trên chỉ đại diện cho quan điểm của tác giả hoặc khách mời. Nó không đại diện cho quan điểm hoặc lập trường của FOLLOWME và không có nghĩa là FOLLOWME đồng ý với tuyên bố hoặc mô tả của họ, cũng không cấu thành bất kỳ lời khuyên đầu tư nào. Đối với tất cả các hành động do khách truy cập thực hiện dựa trên thông tin do cộng đồng FOLLOWME cung cấp, cộng đồng không chịu bất kỳ hình thức trách nhiệm nào trừ khi có cam kết rõ ràng bằng văn bản.
Website Cộng đồng Giao Dịch FOLLOWME: www.followme.asia


Tải thất bại ()