In this technical article we’re going to look at the Elliott Wave charts of the AUD/JPY forex pair published in members' area of the website. The pair has recently given us a 3 waves bounce that completed precisely at the equal legs area as we expected. In the following text, we’ll explain the Elliott Wave analysis and present target areas.
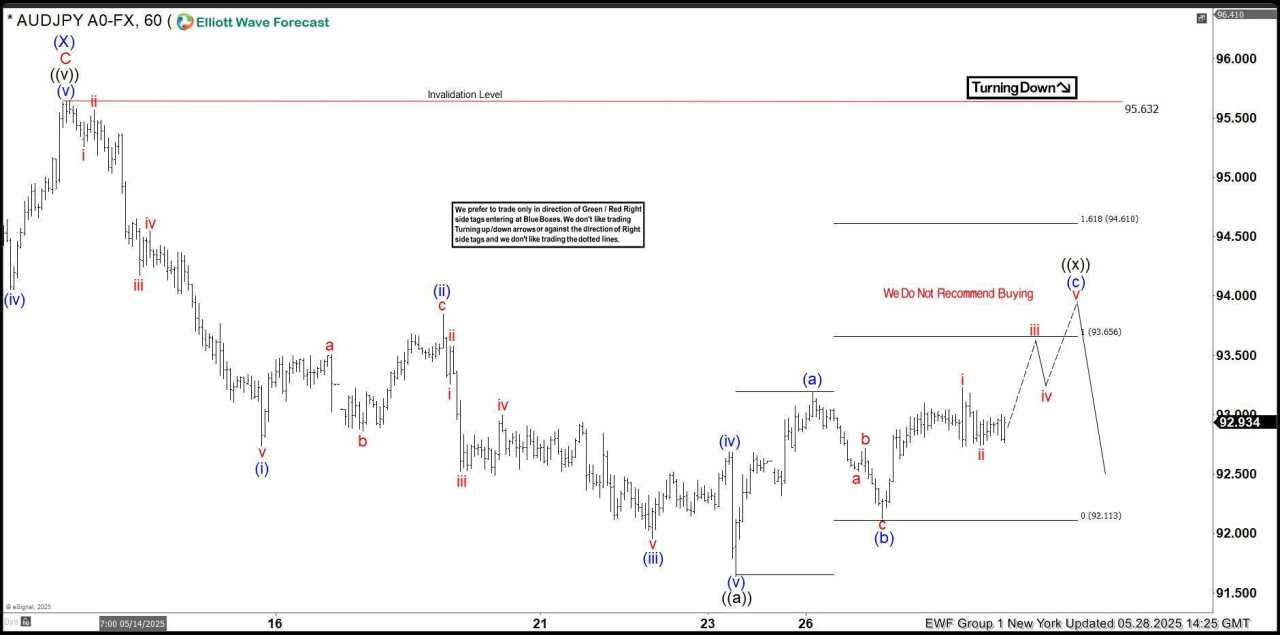
AUD/JPY Elliott Wave one-hour chart 05.28.2025
AUD/JPY is currently forming a three-wave pullback against the 95.63 peak, unfolding as a Zig Zag pattern — (a)-(b)-(c). Our members are aware that we get the potential reversal area by measuring the Equal Legs zone, (a)-(b). This zone comes at 93.65-94.61 area. We expect sellers to emerge within this region and anticipate a continuation of the decline toward new lows ideally.
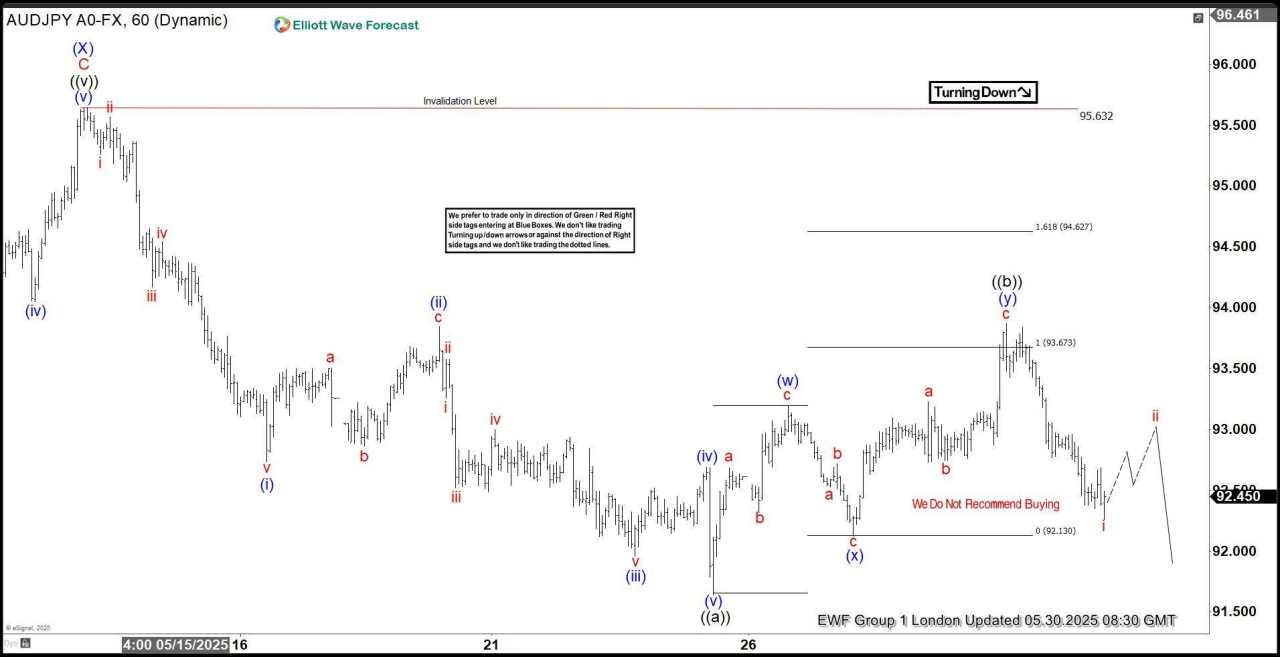
AUD/JPY Elliott Wave one-hour chart 05.28.2025
The pair found sellers as expected in the Equal Legs area and has delivered a decent decline so far. We would now like to see a break below the May 23rd low to confirm that the next leg lower is in place. In that case, further downside extension would be expected, ideally targeting the 89.86 area.
Được in lại từ FXStreet, bản quyền được giữ lại bởi tác giả gốc.
Tuyên bố miễn trừ trách nhiệm: Nội dung trên chỉ đại diện cho quan điểm của tác giả hoặc khách mời. Nó không đại diện cho quan điểm hoặc lập trường của FOLLOWME và không có nghĩa là FOLLOWME đồng ý với tuyên bố hoặc mô tả của họ, cũng không cấu thành bất kỳ lời khuyên đầu tư nào. Đối với tất cả các hành động do khách truy cập thực hiện dựa trên thông tin do cộng đồng FOLLOWME cung cấp, cộng đồng không chịu bất kỳ hình thức trách nhiệm nào trừ khi có cam kết rõ ràng bằng văn bản.
Website Cộng đồng Giao Dịch FOLLOWME: www.followme.asia


Tải thất bại ()