- USD/CHF reverses from 0.8250 highs, invalidating bullish engulfing pattern as sellers fade rally.
- RSI momentum favors bears; break below 0.8155 could expose 0.8100 and YTD low at 0.8038.
- Bulls need to reclaim 0.8200 and close above 0.8249 to challenge 0.8300 resistance.
USD/CHF drops from around three-day highs near 0.8250 and tumbles as the Greenback prolongs its agony, following a slight recovery on Tuesday. At the time of writing, the pair trades at 0.8174, down 0.78%.
USD/CHF Price Forecast: Technical outlook
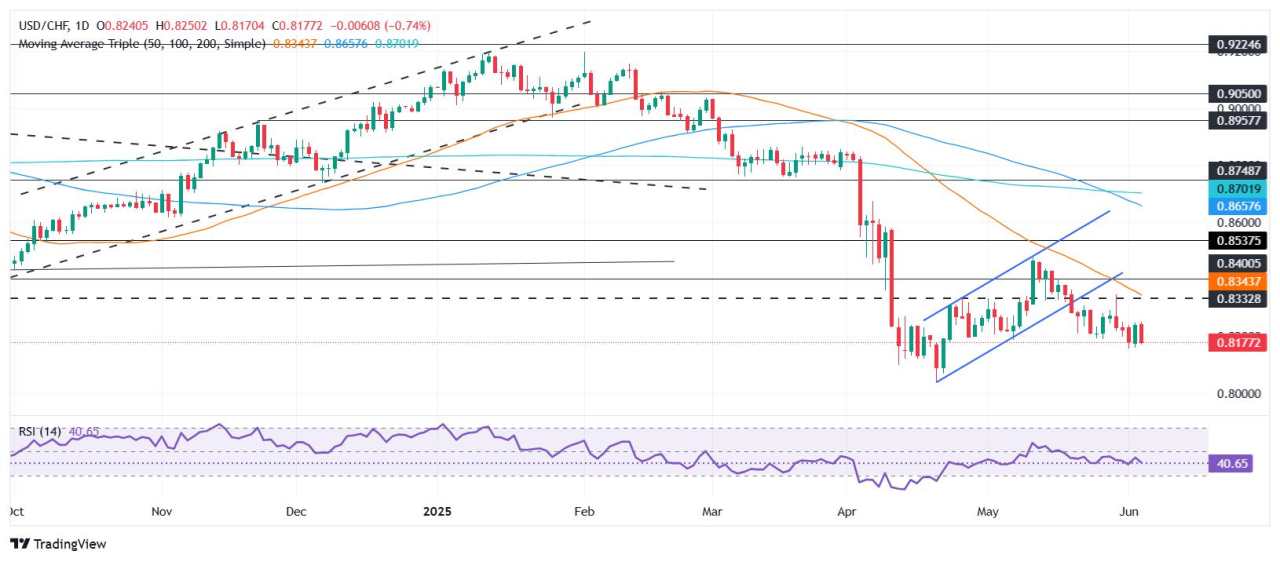
The USD/CHF has resumed its downtrend after forming a ‘bullish engulfing’ candle chart pattern that was invalidated once the pair erased the majority of US Dollar gains in the previous session, a signal that sellers “sold the rallies” in a downtrend.
The Relative Strength Index (RSI) signals that sellers remain in charge, stepping in near the USD/CHF 0.8250 area.
With the path of least resistance tilted to the downside, the USD/CHF could test the current month-to-date (MTD) low of 0.8155. A breach of the latter could exacerbate a move towards 0.8100, followed by a challenge of the year-to-date (YTD) low of 08038.
On the flip side, if USD/CHF surprisingly climbs above 0.8200, bulls could have the chance to test the weekly peak at 0.8249. A daily close above the latter, and look for a move to 0.83.
USD/CHF Price Chart – Daily
Swiss Franc PRICE This week
The table below shows the percentage change of Swiss Franc (CHF) against listed major currencies this week. Swiss Franc was the strongest against the US Dollar.
| USD | EUR | GBP | JPY | CAD | AUD | NZD | CHF | |
|---|---|---|---|---|---|---|---|---|
| USD | -0.63% | -0.68% | -0.74% | -0.55% | -0.98% | -1.14% | -0.65% | |
| EUR | 0.63% | -0.07% | -0.11% | 0.07% | -0.35% | -0.55% | -0.02% | |
| GBP | 0.68% | 0.07% | -0.02% | 0.14% | -0.28% | -0.48% | 0.02% | |
| JPY | 0.74% | 0.11% | 0.02% | 0.20% | -0.25% | -0.42% | -0.03% | |
| CAD | 0.55% | -0.07% | -0.14% | -0.20% | -0.43% | -0.62% | -0.10% | |
| AUD | 0.98% | 0.35% | 0.28% | 0.25% | 0.43% | -0.13% | 0.40% | |
| NZD | 1.14% | 0.55% | 0.48% | 0.42% | 0.62% | 0.13% | 0.50% | |
| CHF | 0.65% | 0.02% | -0.02% | 0.03% | 0.10% | -0.40% | -0.50% |
The heat map shows percentage changes of major currencies against each other. The base currency is picked from the left column, while the quote currency is picked from the top row. For example, if you pick the Swiss Franc from the left column and move along the horizontal line to the US Dollar, the percentage change displayed in the box will represent CHF (base)/USD (quote).
Được in lại từ FXStreet_id, bản quyền được giữ lại bởi tác giả gốc.
Tuyên bố miễn trừ trách nhiệm: Quan điểm được trình bày hoàn toàn là của tác giả và không đại diện cho quan điểm chính thức của Followme. Followme không chịu trách nhiệm về tính chính xác, đầy đủ hoặc độ tin cậy của thông tin được cung cấp và không chịu trách nhiệm cho bất kỳ hành động nào được thực hiện dựa trên nội dung, trừ khi được nêu rõ bằng văn bản.


Tải thất bại ()