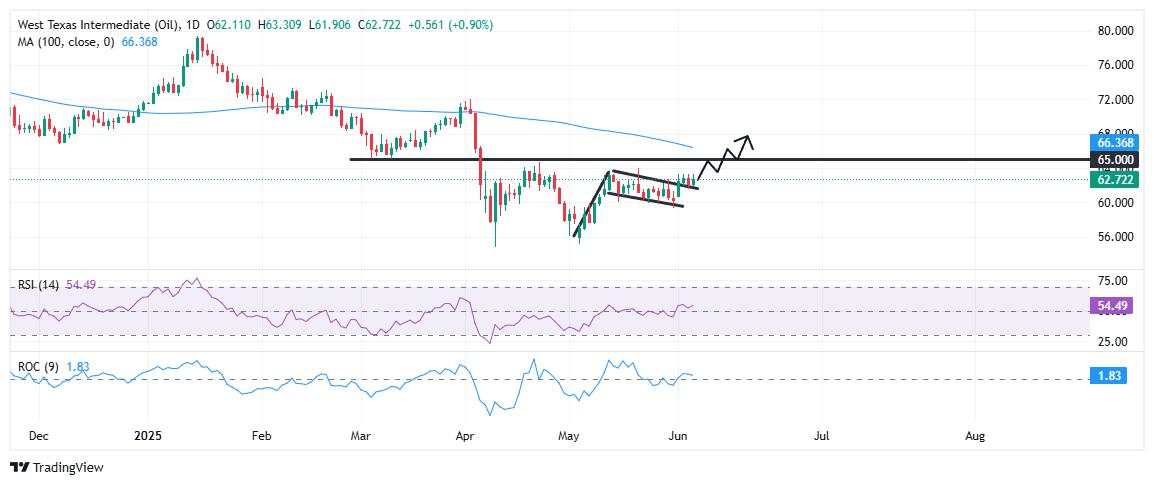
- WTI trades around $62.80 on Thursday, up 1.20% but below the session high of $63.30.
- Price action breaks out of bullish flag pattern, confirming short-term upside bias.
- Immediate resistance seen at $63.00–$63.50; sustained break could target $65.00 and $66.37 (100-day SMA).
- Support rests at $62.00; a break below may drag prices back to $60.00.
West Texas Intermediate (WTI) crude oil extends its recovery on Thursday, building on early week gains as bulls capitalize on a bullish flag breakout. At the time of writing, WTI is trading around $62.80, up nearly 1.20% on the day, and just below the intraday high of $63.30. The recent price action reflects a healthy consolidation phase following Monday’s sharp 3% rally, suggesting that the upward momentum remains intact as traders eye key resistance levels ahead.
From a technical standpoint, the recent breakout from a bullish flag formation adds weight to the ongoing upside bias. This continuation setup emerged after Monday’s strong rally and was followed by a modest, downward-sloping pullback — a typical sign of profit-taking within an uptrend.
The breakout has so far held above the $62.00 level, but bulls now face a near-term test at the $63.00–$63.50 resistance zone. This range, just shy of the week’s high, has acted as a short-term cap and needs to be cleared decisively to confirm bullish control and open the path toward the $65.00 psychological barrier, which has capped gains since mid-April. Furthermore, the 100-day Simple Moving Average (SMA) at $66.37 serves as the next major technical target.
On the downside, if WTI fails to hold above $62.00, prices could fall back into the flag pattern, with key support near the $60.00 round figure at the lower end of the channel. A break below that would weaken the bullish outlook.
Momentum indicators continue to support the upside setup. The 14-day Relative Strength Index (RSI) is gradually rising and currently stands at 54.49 — comfortably above the neutral 50 mark, indicating bullish momentum without flashing overbought conditions. The Rate of Change (ROC) indicator also holds in positive territory, signaling persistent upward pressure. As long as the price holds above $62.00, the bullish breakout remains valid. However, a sustained drop below this threshold would raise the risk of a false breakout, with a potential slide back into the flag channel and the $60.00 area emerging as critical support at the lower end of the pattern.
Được in lại từ FXStreet, bản quyền được giữ lại bởi tác giả gốc.
Tuyên bố miễn trừ trách nhiệm: Nội dung trên chỉ đại diện cho quan điểm của tác giả hoặc khách mời. Nó không đại diện cho quan điểm hoặc lập trường của FOLLOWME và không có nghĩa là FOLLOWME đồng ý với tuyên bố hoặc mô tả của họ, cũng không cấu thành bất kỳ lời khuyên đầu tư nào. Đối với tất cả các hành động do khách truy cập thực hiện dựa trên thông tin do cộng đồng FOLLOWME cung cấp, cộng đồng không chịu bất kỳ hình thức trách nhiệm nào trừ khi có cam kết rõ ràng bằng văn bản.
Website Cộng đồng Giao Dịch FOLLOWME: www.followme.asia


Tải thất bại ()