- AUD/JPY may find a barrier at the three-month high of 95.65.
- Bullish bias prevails as the 14-day RSI is positioned above the 50 mark.
- The primary support appears at the nine-day EMA of 93.51.
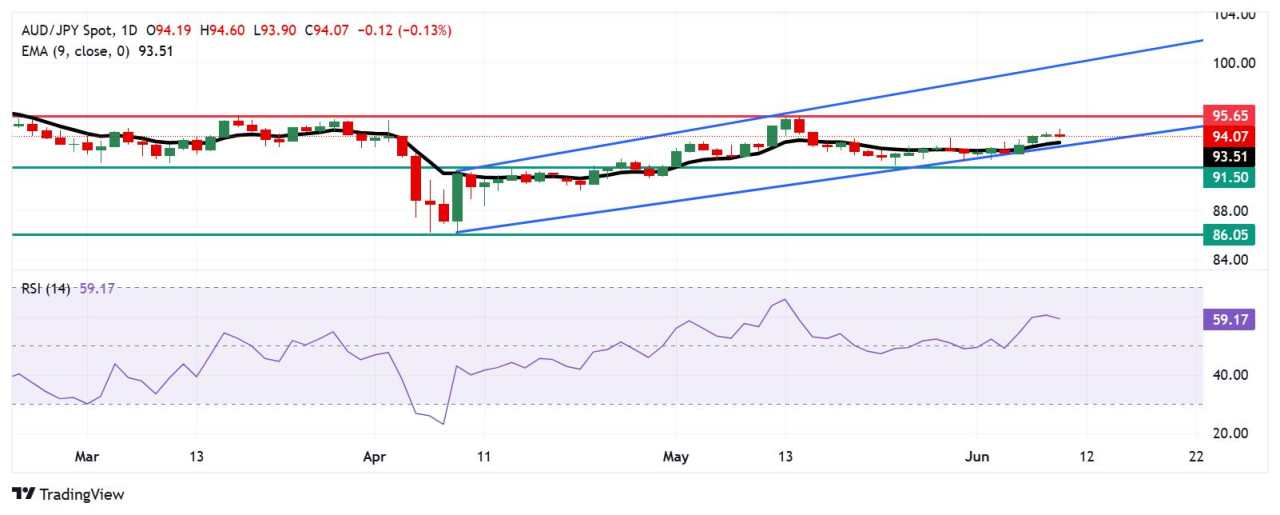
AUD/JPY edges lower after registering gains in the previous three consecutive sessions, trading around 94.10 during European hours on Tuesday. As per the technical analysis of the daily chart, the currency cross remains within an ascending channel pattern, confirming a sustained bullish bias.
The 14-day Relative Strength Index (RSI) stays above the 50 level, strengthening the bullish bias. Additionally, the AUD/JPY cross continues to trade above the nine-day Exponential Moving Average (EMA), indicating short-term price momentum is stronger.
On the upside, the AUD/JPY cross could approach the three-month high at 95.65, which was marked on May 13. Further appreciations above this level could strengthen the bullish sentiment and support the pair to explore the region around the upper boundary of the ascending channel at 99.80.
The AUD/JPY cross may target the primary support at the nine-day EMA of 93.51, aligned with the ascending channel’s lower boundary around 93.40. Next support appears at the 50-day EMA of 93.05, followed by the two-month low at 91.50, recorded on May 1.
AUD/JPY: Daily Chart
Australian Dollar PRICE Today
The table below shows the percentage change of Australian Dollar (AUD) against listed major currencies today. Australian Dollar was the weakest against the Swiss Franc.
| USD | EUR | GBP | JPY | CAD | AUD | NZD | CHF | |
|---|---|---|---|---|---|---|---|---|
| USD | 0.22% | 0.54% | 0.07% | 0.11% | 0.23% | 0.23% | -0.01% | |
| EUR | -0.22% | 0.34% | -0.16% | -0.07% | 0.04% | 0.02% | -0.20% | |
| GBP | -0.54% | -0.34% | -0.58% | -0.41% | -0.29% | -0.32% | -0.53% | |
| JPY | -0.07% | 0.16% | 0.58% | 0.08% | 0.14% | 0.09% | -0.15% | |
| CAD | -0.11% | 0.07% | 0.41% | -0.08% | 0.10% | 0.09% | -0.12% | |
| AUD | -0.23% | -0.04% | 0.29% | -0.14% | -0.10% | -0.01% | -0.24% | |
| NZD | -0.23% | -0.02% | 0.32% | -0.09% | -0.09% | 0.00% | -0.21% | |
| CHF | 0.00% | 0.20% | 0.53% | 0.15% | 0.12% | 0.24% | 0.21% |
The heat map shows percentage changes of major currencies against each other. The base currency is picked from the left column, while the quote currency is picked from the top row. For example, if you pick the Australian Dollar from the left column and move along the horizontal line to the US Dollar, the percentage change displayed in the box will represent AUD (base)/USD (quote).
Được in lại từ FXStreet_id, bản quyền được giữ lại bởi tác giả gốc.
Tuyên bố miễn trừ trách nhiệm: Quan điểm được trình bày hoàn toàn là của tác giả và không đại diện cho quan điểm chính thức của Followme. Followme không chịu trách nhiệm về tính chính xác, đầy đủ hoặc độ tin cậy của thông tin được cung cấp và không chịu trách nhiệm cho bất kỳ hành động nào được thực hiện dựa trên nội dung, trừ khi được nêu rõ bằng văn bản.

Để lại tin nhắn của bạn ngay bây giờ