- USD/CHF may target the primary support at the descending channel around 0.8110
- Bearish bias strengthens as the 14-day Relative Strength Index remains below the 50 mark.
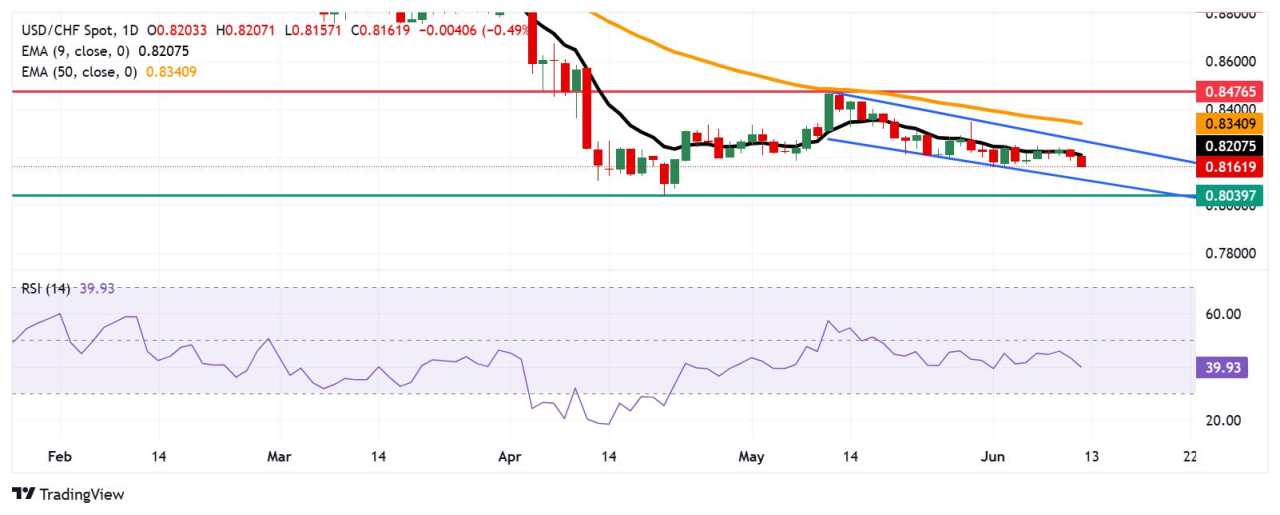
- The nine-day EMA at 0.8207 acts as the primary resistance.
The USD/CHF pair continues to lose ground for the second consecutive day, trading around 0.8170 during the European hours on Thursday. However, the bearish bias is prevailing as the pair moves downwards within the descending channel pattern, indicated by the daily chart’s technical analysis.
The USD/CHF pair falls below the nine-day Exponential Moving Average (EMA), suggesting short-term momentum is weakening. Additionally, the 14-day Relative Strength Index (RSI) remains below the 50 mark, indicating a prevailing bearish bias.
On the downside, the lower boundary of the descending channel around 0.8110 could act as the primary support. Further decline below the channel could reinforce the bearish bias and put downward pressure on the USD/CHF pair to navigate the region around 0.8039, the lowest level since November 2011, which was last seen on April 21.
The USD/CHF pair may test the initial barrier at the nine-day EMA of 0.8207. A break above this level could improve the short-term price momentum and support the pair to explore the area around the descending channel’s upper boundary at 0.8270, followed by the 50-day EMA at 0.8340.
USD/CHF: Daily Chart
Swiss Franc PRICE Today
The table below shows the percentage change of Swiss Franc (CHF) against listed major currencies today. Swiss Franc was the strongest against the Australian Dollar.
| USD | EUR | GBP | JPY | CAD | AUD | NZD | CHF | |
|---|---|---|---|---|---|---|---|---|
| USD | -0.29% | 0.06% | -0.42% | -0.03% | 0.32% | 0.28% | -0.56% | |
| EUR | 0.29% | 0.35% | -0.12% | 0.26% | 0.58% | 0.58% | -0.24% | |
| GBP | -0.06% | -0.35% | -0.51% | -0.09% | 0.22% | 0.21% | -0.62% | |
| JPY | 0.42% | 0.12% | 0.51% | 0.38% | 0.71% | 0.65% | -0.14% | |
| CAD | 0.03% | -0.26% | 0.09% | -0.38% | 0.35% | 0.30% | -0.53% | |
| AUD | -0.32% | -0.58% | -0.22% | -0.71% | -0.35% | -0.01% | -0.84% | |
| NZD | -0.28% | -0.58% | -0.21% | -0.65% | -0.30% | 0.00% | -0.83% | |
| CHF | 0.56% | 0.24% | 0.62% | 0.14% | 0.53% | 0.84% | 0.83% |
The heat map shows percentage changes of major currencies against each other. The base currency is picked from the left column, while the quote currency is picked from the top row. For example, if you pick the Swiss Franc from the left column and move along the horizontal line to the US Dollar, the percentage change displayed in the box will represent CHF (base)/USD (quote).
Được in lại từ FXStreet, bản quyền được giữ lại bởi tác giả gốc.
Tuyên bố miễn trừ trách nhiệm: Nội dung trên chỉ đại diện cho quan điểm của tác giả hoặc khách mời. Nó không đại diện cho quan điểm hoặc lập trường của FOLLOWME và không có nghĩa là FOLLOWME đồng ý với tuyên bố hoặc mô tả của họ, cũng không cấu thành bất kỳ lời khuyên đầu tư nào. Đối với tất cả các hành động do khách truy cập thực hiện dựa trên thông tin do cộng đồng FOLLOWME cung cấp, cộng đồng không chịu bất kỳ hình thức trách nhiệm nào trừ khi có cam kết rõ ràng bằng văn bản.
Website Cộng đồng Giao Dịch FOLLOWME: www.followme.asia


Tải thất bại ()