- AUD/JPY drops 0.25% on Thursday, extending retreat below 94.00 for the second straight session.
- Bearish engulfing pattern weighed on price, but RSI holding above 50 suggests downside momentum is weakening.
- First resistance aligns at 94.00; a break may expose 95.00 and May’s peak at 95.63.
- Support seen at Senkou Span A (93.51), followed by Tenkan-sen (93.39) and the psychological 93.00 level.
AUD/JPY retreated for the second consecutive day, remained below the 94.00 figure, and printed losses of 0.25% on Thursday. At the time of writing, the cross-pair trades at 93.66, virtually unchanged.
AUD/JPY Price Forecast: Technical outlook
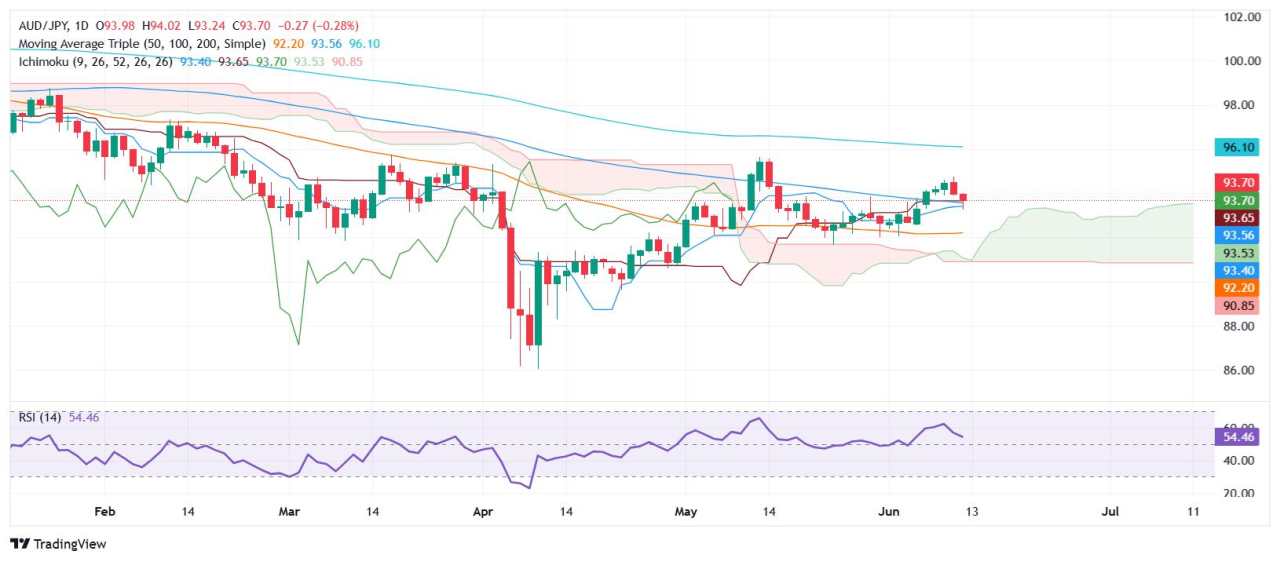
The AUD/JPY pair formed a ‘bearish engulfing’ candle chart pattern, which sent the pair drifting toward its weekly low of 93.22 on June 12 before recovering some ground. The Relative Strength Index (RSI) appears to have bottomed above its 50-neutral line, indicating that buyers are stepping in. Therefore, an improvement in risk appetite and Japanese Yen (JPY) weakness could send the cross higher.
The first resistance level would be the 94.00 figure. If surpassed, the next resistance would be 95.00, followed by the May 13 daily high at 95.63. The following key resistance levels are 96.00 and the February 12 high of 97.32.
On the flip side, if AUD/JPY tumbles below the Senkou Span A at 93.51, up next lies the Tenkan-sen at 93.39, ahead of the 93.00 figure.
AUD/JPY Price Chart – Daily
Australian Dollar PRICE This week
The table below shows the percentage change of Australian Dollar (AUD) against listed major currencies this week. Australian Dollar was the strongest against the US Dollar.
| USD | EUR | GBP | JPY | CAD | AUD | NZD | CHF | |
|---|---|---|---|---|---|---|---|---|
| USD | -1.66% | -0.65% | -0.98% | -0.68% | -0.53% | -0.79% | -1.39% | |
| EUR | 1.66% | 1.02% | 0.68% | 0.99% | 1.17% | 0.88% | 0.26% | |
| GBP | 0.65% | -1.02% | -0.23% | -0.02% | 0.16% | -0.14% | -0.75% | |
| JPY | 0.98% | -0.68% | 0.23% | 0.31% | 0.40% | 0.13% | -0.54% | |
| CAD | 0.68% | -0.99% | 0.02% | -0.31% | 0.13% | -0.11% | -0.72% | |
| AUD | 0.53% | -1.17% | -0.16% | -0.40% | -0.13% | -0.29% | -0.89% | |
| NZD | 0.79% | -0.88% | 0.14% | -0.13% | 0.11% | 0.29% | -0.61% | |
| CHF | 1.39% | -0.26% | 0.75% | 0.54% | 0.72% | 0.89% | 0.61% |
The heat map shows percentage changes of major currencies against each other. The base currency is picked from the left column, while the quote currency is picked from the top row. For example, if you pick the Australian Dollar from the left column and move along the horizontal line to the US Dollar, the percentage change displayed in the box will represent AUD (base)/USD (quote).
Được in lại từ FXStreet, bản quyền được giữ lại bởi tác giả gốc.
Tuyên bố miễn trừ trách nhiệm: Nội dung trên chỉ đại diện cho quan điểm của tác giả hoặc khách mời. Nó không đại diện cho quan điểm hoặc lập trường của FOLLOWME và không có nghĩa là FOLLOWME đồng ý với tuyên bố hoặc mô tả của họ, cũng không cấu thành bất kỳ lời khuyên đầu tư nào. Đối với tất cả các hành động do khách truy cập thực hiện dựa trên thông tin do cộng đồng FOLLOWME cung cấp, cộng đồng không chịu bất kỳ hình thức trách nhiệm nào trừ khi có cam kết rõ ràng bằng văn bản.
Website Cộng đồng Giao Dịch FOLLOWME: www.followme.asia


Tải thất bại ()