US stock markets have staged a sharp V-shaped rebound since the April low, with the Dow Jones Industrial Average up 16%, the S&P 500 climbing 22%, and the tech-heavy Nasdaq Composite surging 31%. The rally has been fuelled by risk-on sentiment following the Trump administration’s reversal on tariffs and a strong US earnings season, particularly among hyperscalers. A supportive macroeconomic environment has also underpinned the advance, with easing inflation, expectations of Fed rate cuts, and a broadly resilient US economy, even as early signs of slowing growth begin to emerge.
However, the recent rally may now be primed for a bout of profit-taking ahead of next week’s Federal Reserve meeting. Despite mounting political pressure from President Trump to ease monetary policy, the Fed is expected to take a cautious, gradual approach to cutting interest rates. Tariff-induced inflationary risks remain a key concern for the central bank. Although May’s CPI reading came in cooler than anticipated, inflation still sits above the Fed’s 2% target.
In addition, escalating geopolitical tensions could weigh further on risk assets. Israeli airstrikes on Iran sparked a sharp selloff in global stock markets during Friday’s Asian session. All three major US index futures fell significantly, with technology stocks leading the losses. Other risk-sensitive assets, including industrial metals and commodity-linked currencies, also declined, while crude oil prices spiked about 8% to a four-month high.
From a technical perspective, overbought conditions and emerging bearish divergence signals suggest a likely pullback in the major US indices. Meanwhile, I maintain a bullish view on the US dollar in the near term, as it regains its role as a haven asset amid rising geopolitical risk.
Bearish divergence emerges in the Nasdaq
Chart 1 – Nasdaq 100 futures, daily

Source: TradingView as of 13 Jun 2025
A bearish divergence between the price and the stochastic trend has emerged in the Nasdaq 100, accompanied by overbought conditions. This indicates the potential for a deeper correction after the index’s more than 30% surge over the past two months. Immediate support lies at the 23.6% Fibonacci retracement level, which aligns with the 23 May low around 20,758. Further downside support may be found at the 38.2% retracement, around 19,933.
On the flip side, the recent high of 22,106 marks a key resistance level to the upside.
A bullish divergence emerges in DXY
Chart 2 – The US Dollar Index, daily
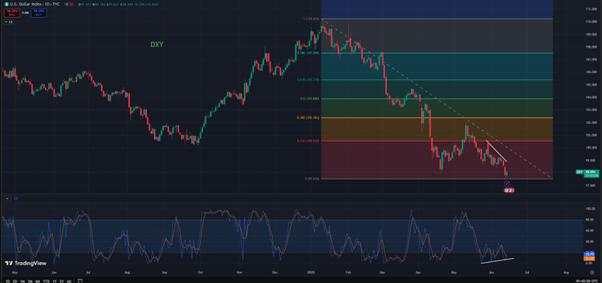
Source: TradingView as of 13 Jun 2025
A potential bullish divergence has appeared in the US dollar index (DXY), with the stochastic oscillator turning higher from oversold territory. Thursday’s low of 97.62 now acts as near-term support, while the immediate resistance stands at the 10 June high of 99.39. A possible double-bottom formation is also developing; if confirmed, it could see the DXY rebound above the psychological level of 100.
On the flip side, a break below the recent low could accelerate the dollar’s decline towards 95.
Được in lại từ FXStreet, bản quyền được giữ lại bởi tác giả gốc.
Tuyên bố miễn trừ trách nhiệm: Nội dung trên chỉ đại diện cho quan điểm của tác giả hoặc khách mời. Nó không đại diện cho quan điểm hoặc lập trường của FOLLOWME và không có nghĩa là FOLLOWME đồng ý với tuyên bố hoặc mô tả của họ, cũng không cấu thành bất kỳ lời khuyên đầu tư nào. Đối với tất cả các hành động do khách truy cập thực hiện dựa trên thông tin do cộng đồng FOLLOWME cung cấp, cộng đồng không chịu bất kỳ hình thức trách nhiệm nào trừ khi có cam kết rõ ràng bằng văn bản.
Website Cộng đồng Giao Dịch FOLLOWME: www.followme.asia


Tải thất bại ()