Weekly thoughts
Have you been paying attention to commodities?
People are talking about the next ‘commodity supercycle’.
That’s a fun word for all commodity prices going up a lot. The theory goes that it started in 2020 in the aftermath of the pandemic but it’s really only been gold that has been rising since then. Now the other commodities are starting to wake up..
In last week’s report (week 23), we talked about the EPIC breakout in silver.
Gold and silver have now potentially been joined by the ‘big boss’ of commodities - oil.
Regular readers will remember we talked about oil in our final report of 2024 asking whether it will be ‘Top trade of 2025’. Well it still might be - just not in the way we expected. More on that in a minute.
Geopolitics is a tough one. In my experience 9 out of 10 geopolitical events have no lasting effect on markets. But that 1/10 has a huge effect.
Well, as you probably already know, on Friday morning Israel carried out a major attack on Iran’s nuclear facilities. Iran has responded with a series of missile strikes. Israeli counterstrikes over the weekend targeted some of Iran’s energy infrastructure. Iran is the world’s 7th largest oil producer.
There’s no way to know if this conflict will last - or how long-lasting its effects will be on markets. What we do know is that it has contributed towards a massive reversal in the price of crude oil.
Going back to our analysis in week 53 of 2024.
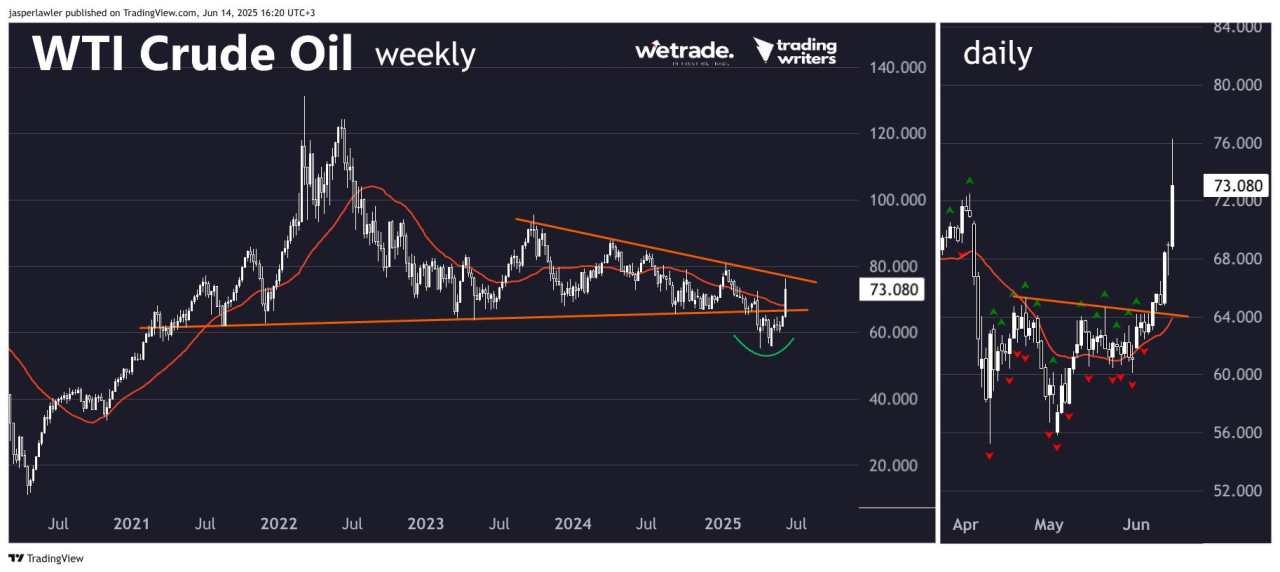
We were looking for a break below the long term triangle pattern (shown in the chart below) as a catalyst for a big move lower in price.
The price saw a substantial break lower but after two failed breaks below $60 per oz in WTI cruise oil, a double bottom pattern formed - and crude is now $20 off its lows.
Big picture, this looks like a failed top pattern.
Failure is bad, right? Well actually, failed ‘reversal’ patterns have shown to be some of the best ‘continuation’ patterns.
If oil couldn’t follow through on its downward break, it shows buyers have taken control.
To repeat what I said above. Geopolitics is tough. I suspect there will be a good amount of up and down volatility as the headlines take over near term.
One possibility is that this conflict cools off and oil heads lower again. But the ‘failed top’ in our view, means it looks like the final destination for oil will be higher - not lower.
Setups and signals
We look at hundreds of charts each week and present you with three of our favourite setups and signals.
WTI Crude Oil (USO/USD)
Setup
WTI crude oil has broken back above its broken support in what appears to be a ‘failed top’ signalling higher prices to come. There is resistance from the top of the triangle pattern under $80 per barrel. A weekly close above the triangle upper trendline + $80 per barrel would confirm the new long term uptrend is ready to take shape.
Signal
Price quickly reached the upside objective of a double bottom pattern on the daily chart after breaking resistance at $64. While price holds above the old high at $72, a continuation to $80 looks likely before a bigger pullback.
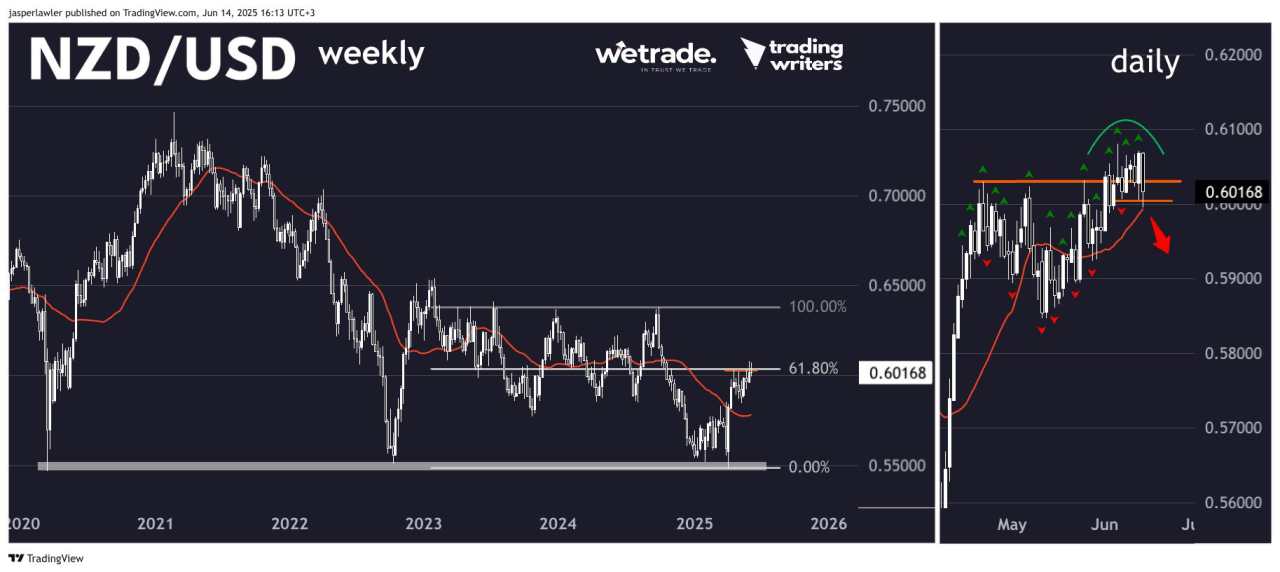
NZD/USD
Setup
We were looking for the pair that best represents what could be about to happen to the USD. We think we found that in NZD/USD. The pair has stalled at the 61.8% retracement of its late 2024 decline.
Signal
On Friday, the USD benefitted from haven flows and put in a bearish engulfing candlestick pattern. A daily close under 0.60 could signal the short term uptrend has reversed.
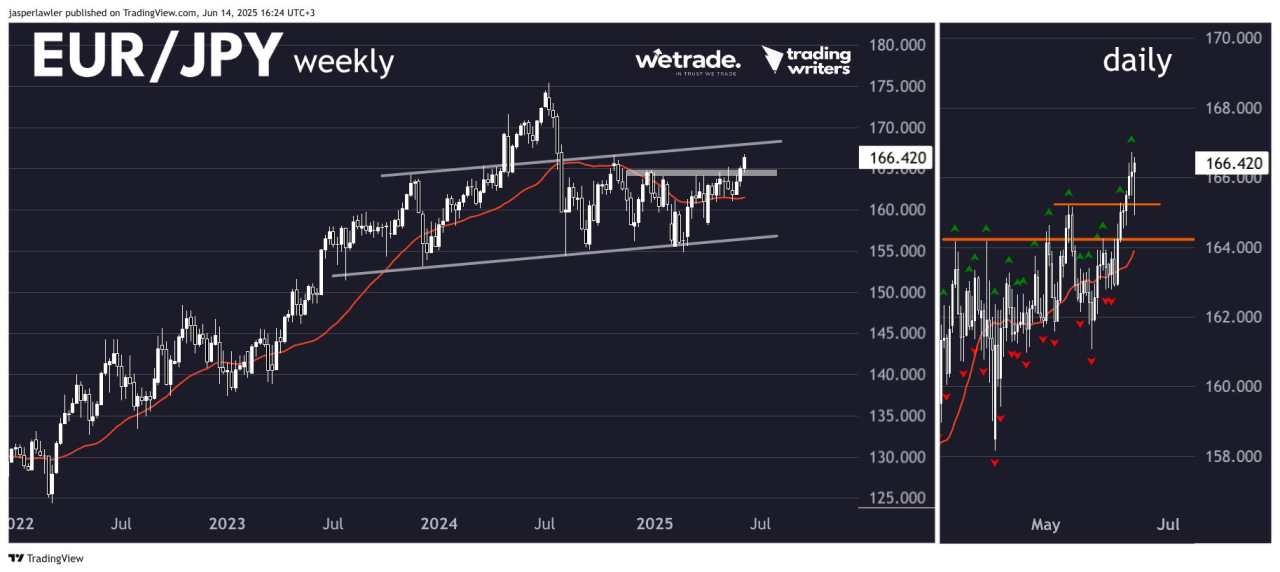
EUR/JPY
Setup
EUR/JPY just put in its highest weekly close since July 2024, breaking above the key 165 threshold. The long term head and shoulders pattern looks like it might have just failed. Last chance is a 2nd right shoulder at the same trendline.
Signal
The near term trend is up. Can take buy signals until any possible sell signals emerge near the long term right shoulder trendline.
Được in lại từ FXStreet, bản quyền được giữ lại bởi tác giả gốc.
Tuyên bố miễn trừ trách nhiệm: Nội dung trên chỉ đại diện cho quan điểm của tác giả hoặc khách mời. Nó không đại diện cho quan điểm hoặc lập trường của FOLLOWME và không có nghĩa là FOLLOWME đồng ý với tuyên bố hoặc mô tả của họ, cũng không cấu thành bất kỳ lời khuyên đầu tư nào. Đối với tất cả các hành động do khách truy cập thực hiện dựa trên thông tin do cộng đồng FOLLOWME cung cấp, cộng đồng không chịu bất kỳ hình thức trách nhiệm nào trừ khi có cam kết rõ ràng bằng văn bản.
Website Cộng đồng Giao Dịch FOLLOWME: www.followme.asia


Tải thất bại ()