- NZD/JPY rallies to 87.69 after bouncing from intraday low near 86.56.
- RSI flattens near 60, signaling potential pause before next leg higher.
- Bulls aim for 88.00, 89.71 YTD high, and psychological 90.00 barrier.
The NZD/JPY rallied sharply and posted gains of over 1%, trading at 87.69 after bouncing off daily lows of 86.56, clearing key technical resistance levels, as the pair seems poised to challenge the year-to-date (YTD) high of 89.71.
NZD/JPY Price Forecast: Technical outlook
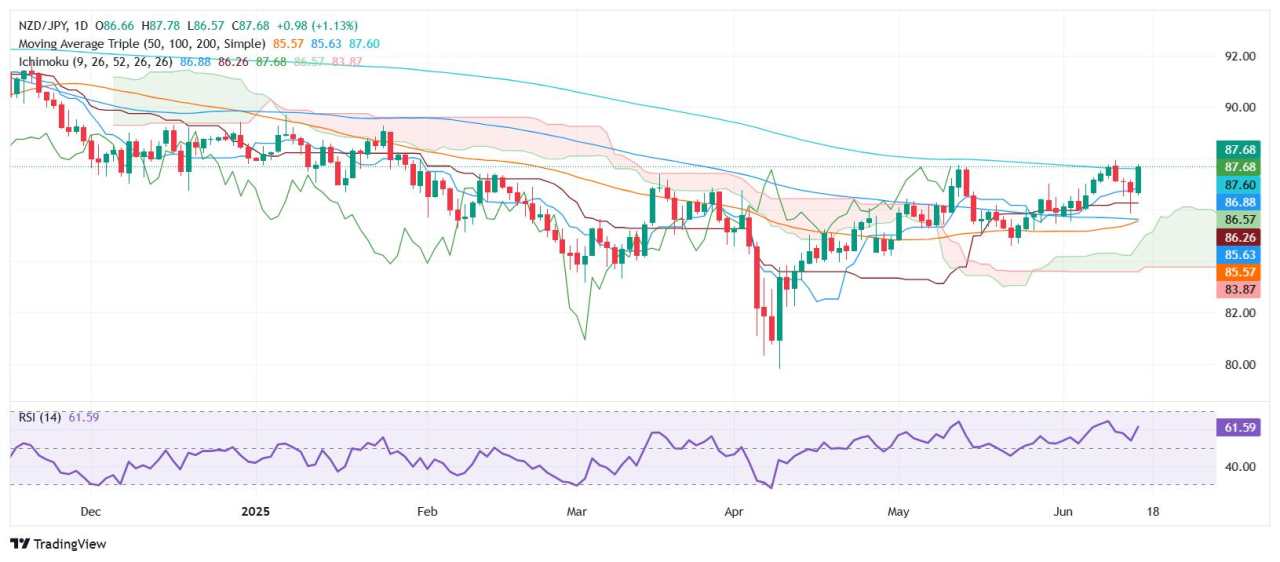
The NZD/JPY appears poised to surpass the May 13 daily high of 87.73, potentially opening the door for further upside. Momentum, as measured by the Relative Strength Index (RSI), indicates that buyers are taking a respite, with the RSI turning flat after reaching the 60 threshold. Therefore, some consolidation lies ahead.
Despite this, the path of least resistance is tilted upward. With that said, the NZD/JPY first resistance would be the 88.00 figure. Once cleared, the next stop would be 89.00, followed by the YTD peak of 89.71 before challenging the 90.00 figure.
Conversely, the least likely path is that the first support for the NZD/JPY would be at 87.00, followed by the Tenkan-sen at 86.88, ahead of the Senkou Span A at 86.57. If surpassed, the next floor level would be the Kijun-Sen at 86.26.
NZD/JPY Price Chart – Daily
New Zealand Dollar PRICE This week
The table below shows the percentage change of New Zealand Dollar (NZD) against listed major currencies this week. New Zealand Dollar was the strongest against the US Dollar.
| USD | EUR | GBP | JPY | CAD | AUD | NZD | CHF | |
|---|---|---|---|---|---|---|---|---|
| USD | 0.02% | 0.02% | 0.00% | 0.01% | 0.02% | -0.05% | 0.03% | |
| EUR | -0.02% | -0.02% | 0.03% | -0.01% | 0.04% | 0.01% | 0.00% | |
| GBP | -0.02% | 0.02% | -0.04% | 0.00% | 0.05% | -0.01% | 0.02% | |
| JPY | 0.00% | -0.03% | 0.04% | 0.00% | 0.00% | -0.05% | 0.00% | |
| CAD | -0.01% | 0.01% | -0.00% | -0.00% | -0.07% | 0.00% | 0.02% | |
| AUD | -0.02% | -0.04% | -0.05% | -0.00% | 0.07% | -0.03% | -0.03% | |
| NZD | 0.05% | -0.01% | 0.01% | 0.05% | -0.01% | 0.03% | 0.00% | |
| CHF | -0.03% | -0.00% | -0.02% | -0.00% | -0.02% | 0.03% | -0.00% |
The heat map shows percentage changes of major currencies against each other. The base currency is picked from the left column, while the quote currency is picked from the top row. For example, if you pick the New Zealand Dollar from the left column and move along the horizontal line to the US Dollar, the percentage change displayed in the box will represent NZD (base)/USD (quote).
Được in lại từ FXStreet_id, bản quyền được giữ lại bởi tác giả gốc.
Tuyên bố miễn trừ trách nhiệm: Quan điểm được trình bày hoàn toàn là của tác giả và không đại diện cho quan điểm chính thức của Followme. Followme không chịu trách nhiệm về tính chính xác, đầy đủ hoặc độ tin cậy của thông tin được cung cấp và không chịu trách nhiệm cho bất kỳ hành động nào được thực hiện dựa trên nội dung, trừ khi được nêu rõ bằng văn bản.


Tải thất bại ()