- AUD/JPY slips to 93.99 after strong Monday rally fades amid rising geopolitical risks.
- RSI turns neutral, signaling consolidation near key 94.00 level ahead of Fed meeting.
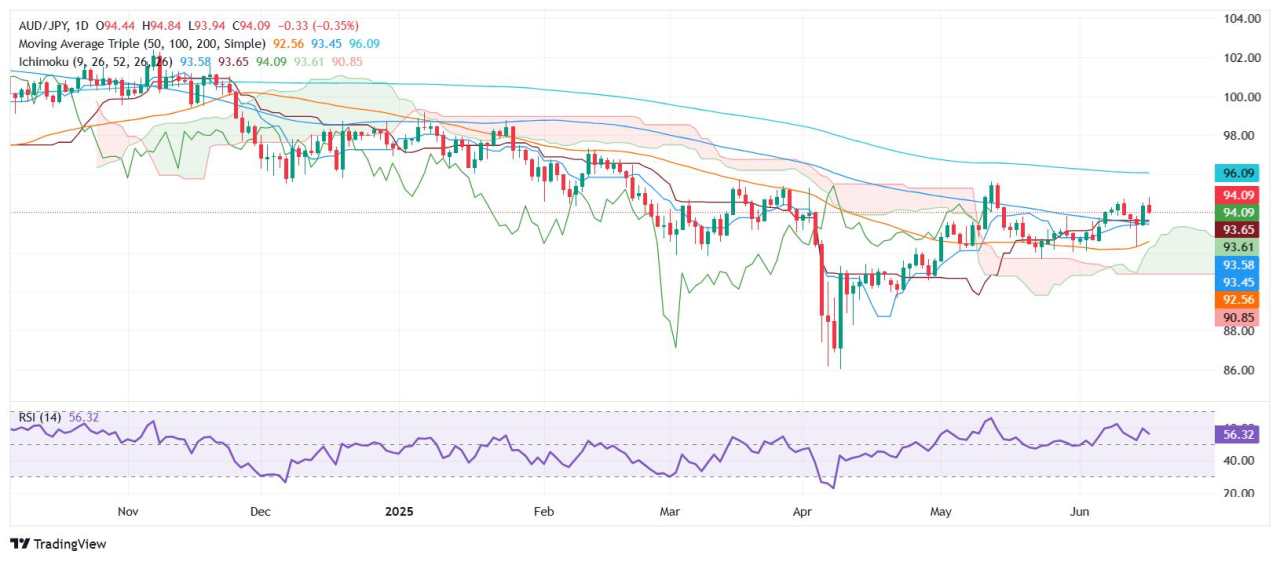
- Downside risks emerge if price breaks below 93.56–93.60 Ichimoku support cluster.
The AUD/JPY reversed its course on Tuesday after posting solid gains on Monday of over 0.98% amid an improvement in market players' mood despite increasing tensions in the Israel-Iran conflict. Nevertheless, reality hit the markets, while a possible involvement of the United States (US) in the conflict shifted sentiment sour. At the time of writing, the cross-pair trades at 93.99, virtually unchanged, after posting losses of 0.37% on Tuesday.
AUD/JPY Price Forecast: Technical outlook
From a technical standpoint, the AUD/JPY seems poised to consolidate on the top/bottom of the 94.00 figure. The Relative Strength Index (RSI) remains bullish, although it is approaching its neutral line, indicating indecision among traders.
If the RSI resumes its upward trend and the AUD/JPY climbs above 94.50, this could pave the way for a bullish reaction. The next key resistance level would be June 17, high at 94.83, followed by the 95.00 figure. A reach of the latter will expose the April 2 peak at 95.30, ahead of February’s monthly high of 97.32.
Conversely, if AUD/JPY slumps below 94.00 and clears the confluence of the Tenkan and Kijun-sen, and the Senkou Span A at around 93.60/93.56, look for a drop toward the June 16 daily low of 93.24, ahead of 93.00.
AUD/JPY Price Chart – Daily
Australian Dollar PRICE This week
The table below shows the percentage change of Australian Dollar (AUD) against listed major currencies this week. Australian Dollar was the strongest against the Japanese Yen.
| USD | EUR | GBP | JPY | CAD | AUD | NZD | CHF | |
|---|---|---|---|---|---|---|---|---|
| USD | 0.49% | 0.99% | 0.52% | 0.67% | 0.08% | 0.02% | 0.54% | |
| EUR | -0.49% | 0.38% | 0.00% | 0.18% | -0.28% | -0.44% | 0.05% | |
| GBP | -0.99% | -0.38% | -0.35% | -0.19% | -0.66% | -0.84% | -0.33% | |
| JPY | -0.52% | 0.00% | 0.35% | 0.17% | -0.72% | -0.80% | -0.39% | |
| CAD | -0.67% | -0.18% | 0.19% | -0.17% | -0.52% | -0.65% | -0.14% | |
| AUD | -0.08% | 0.28% | 0.66% | 0.72% | 0.52% | -0.18% | 0.34% | |
| NZD | -0.02% | 0.44% | 0.84% | 0.80% | 0.65% | 0.18% | 0.52% | |
| CHF | -0.54% | -0.05% | 0.33% | 0.39% | 0.14% | -0.34% | -0.52% |
The heat map shows percentage changes of major currencies against each other. The base currency is picked from the left column, while the quote currency is picked from the top row. For example, if you pick the Australian Dollar from the left column and move along the horizontal line to the US Dollar, the percentage change displayed in the box will represent AUD (base)/USD (quote).
Được in lại từ FXStreet, bản quyền được giữ lại bởi tác giả gốc.
Tuyên bố miễn trừ trách nhiệm: Nội dung trên chỉ đại diện cho quan điểm của tác giả hoặc khách mời. Nó không đại diện cho quan điểm hoặc lập trường của FOLLOWME và không có nghĩa là FOLLOWME đồng ý với tuyên bố hoặc mô tả của họ, cũng không cấu thành bất kỳ lời khuyên đầu tư nào. Đối với tất cả các hành động do khách truy cập thực hiện dựa trên thông tin do cộng đồng FOLLOWME cung cấp, cộng đồng không chịu bất kỳ hình thức trách nhiệm nào trừ khi có cam kết rõ ràng bằng văn bản.
Website Cộng đồng Giao Dịch FOLLOWME: www.followme.asia


Tải thất bại ()