- GBP/USD may find initial resistance at nine-day EMA of 1.3645
- The 14-day Relative Strength Index holds slightly above the 50 mark, reinforcing a mild bullish bias.
- The primary support appears around monthly low at 1.3562.
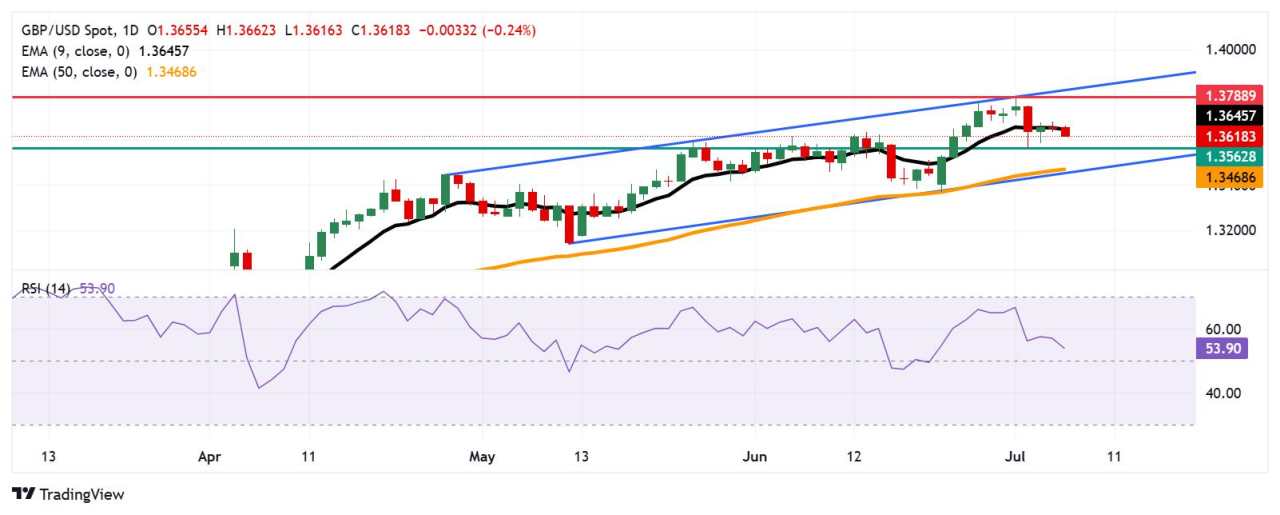
The GBP/USD pair extends its losses for the second successive session, trading around 1.3620 during the Asian hours on Monday. The bullish bias persists as the daily chart’s technical analysis indicates that the pair remains within the ascending channel pattern.
The 14-day Relative Strength Index (RSI) remains slightly above the 50 level, strengthening the bullish bias. However, the GBP/USD pair has moved below the nine-day Exponential Moving Average (EMA), suggesting the short-term price momentum is weaker.
On the upside, the GBP/USD pair may test the immediate barrier at nine-day EMA of 1.3645, followed by the 1.3788, the highest since October 2021, which was recorded on July 1. A successful breach above this level could reinforce the bullish bias and support the pair to approach the upper boundary of the ascending channel around 1.3820.
The GBP/USD pair could target the primary support around monthly low at 1.3562. A break below this level could put downward pressure on the pair to test the 50-day EMA of 1.3468, followed by the ascending channel’s lower boundary around 1.3540.
GBP/USD: Daily Chart
British Pound PRICE Today
The table below shows the percentage change of British Pound (GBP) against listed major currencies today. British Pound was the weakest against the US Dollar.
| USD | EUR | GBP | JPY | CAD | AUD | NZD | CHF | |
|---|---|---|---|---|---|---|---|---|
| USD | 0.14% | 0.28% | 0.59% | 0.28% | 0.85% | 0.85% | 0.19% | |
| EUR | -0.14% | 0.15% | 0.20% | 0.11% | 0.77% | 0.70% | 0.03% | |
| GBP | -0.28% | -0.15% | 0.02% | -0.01% | 0.63% | 0.56% | -0.23% | |
| JPY | -0.59% | -0.20% | -0.02% | -0.07% | 0.48% | 0.49% | -0.34% | |
| CAD | -0.28% | -0.11% | 0.00% | 0.07% | 0.58% | 0.58% | -0.23% | |
| AUD | -0.85% | -0.77% | -0.63% | -0.48% | -0.58% | 0.03% | -0.86% | |
| NZD | -0.85% | -0.70% | -0.56% | -0.49% | -0.58% | -0.03% | -0.80% | |
| CHF | -0.19% | -0.03% | 0.23% | 0.34% | 0.23% | 0.86% | 0.80% |
The heat map shows percentage changes of major currencies against each other. The base currency is picked from the left column, while the quote currency is picked from the top row. For example, if you pick the British Pound from the left column and move along the horizontal line to the US Dollar, the percentage change displayed in the box will represent GBP (base)/USD (quote).
Được in lại từ FXStreet, bản quyền được giữ lại bởi tác giả gốc.
Tuyên bố miễn trừ trách nhiệm: Nội dung trên chỉ đại diện cho quan điểm của tác giả hoặc khách mời. Nó không đại diện cho quan điểm hoặc lập trường của FOLLOWME và không có nghĩa là FOLLOWME đồng ý với tuyên bố hoặc mô tả của họ, cũng không cấu thành bất kỳ lời khuyên đầu tư nào. Đối với tất cả các hành động do khách truy cập thực hiện dựa trên thông tin do cộng đồng FOLLOWME cung cấp, cộng đồng không chịu bất kỳ hình thức trách nhiệm nào trừ khi có cam kết rõ ràng bằng văn bản.
Website Cộng đồng Giao Dịch FOLLOWME: www.followme.asia


Tải thất bại ()