EUR/USD daily chart
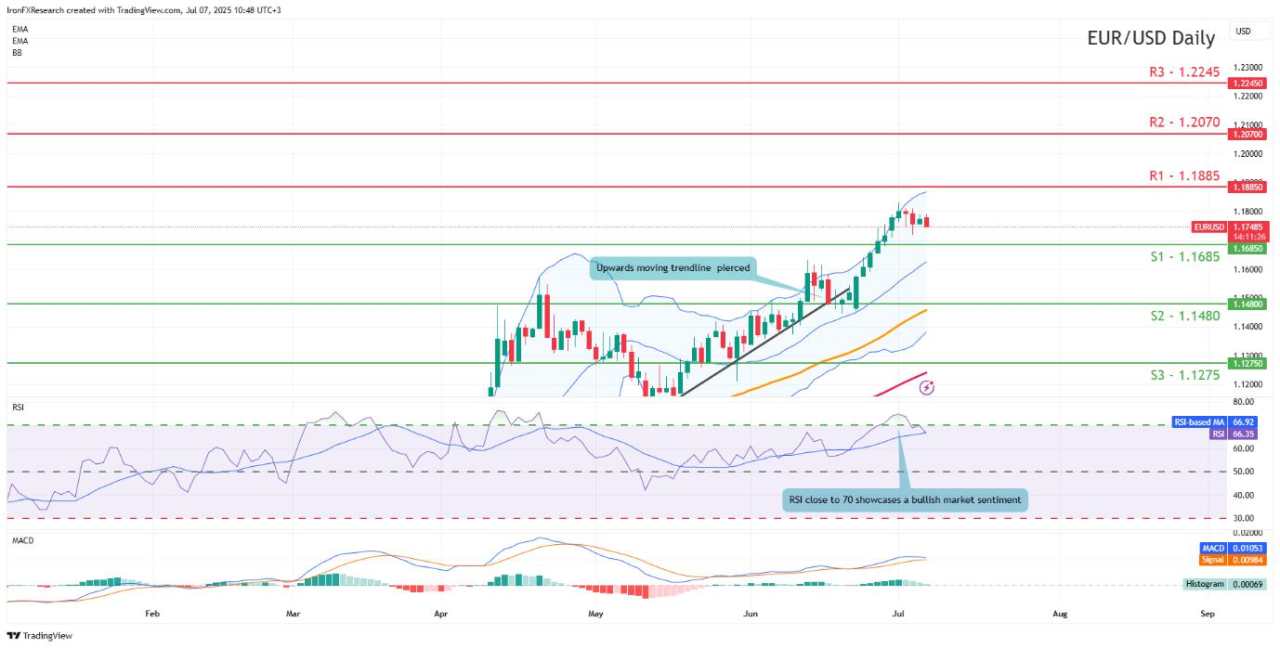
- Support: 1.1685 (S1), 1.1480 (S2), 1.1275 (S3).
- Resistance: 1.1885 (R1), 1.2070 (R2), 1.2245 (R3).
EUR/USD appears to be moving in a predominantly upwards fashion after clearing our resistance now turned to support at the 1.1685 (S1) level. We opt a bullish outlook for the pair and supporting our case is the RSI indicator below our chart which currently registers a figure near 70 implying bullish market sentiment. However we would not be surprised to see the pair moving to test our S1 support level. For our bullish outlook to continue we would require a clear break above the 1.1885 (R1) resistance line with the next possible target for the bulls being the 1.2070 (R2) resistance level. On the other hand, for a bearish outlook we would require a clear break below the 1.1685 (S1) support level with the next possible target for the bears being the 1.1480 (S2) support line. Lastly, for a sideways bias we would require the pair to remain confined between our 1.1685 (S1) support level and our 1.1885 (R1) resistance line.
AUD/USD daily chart
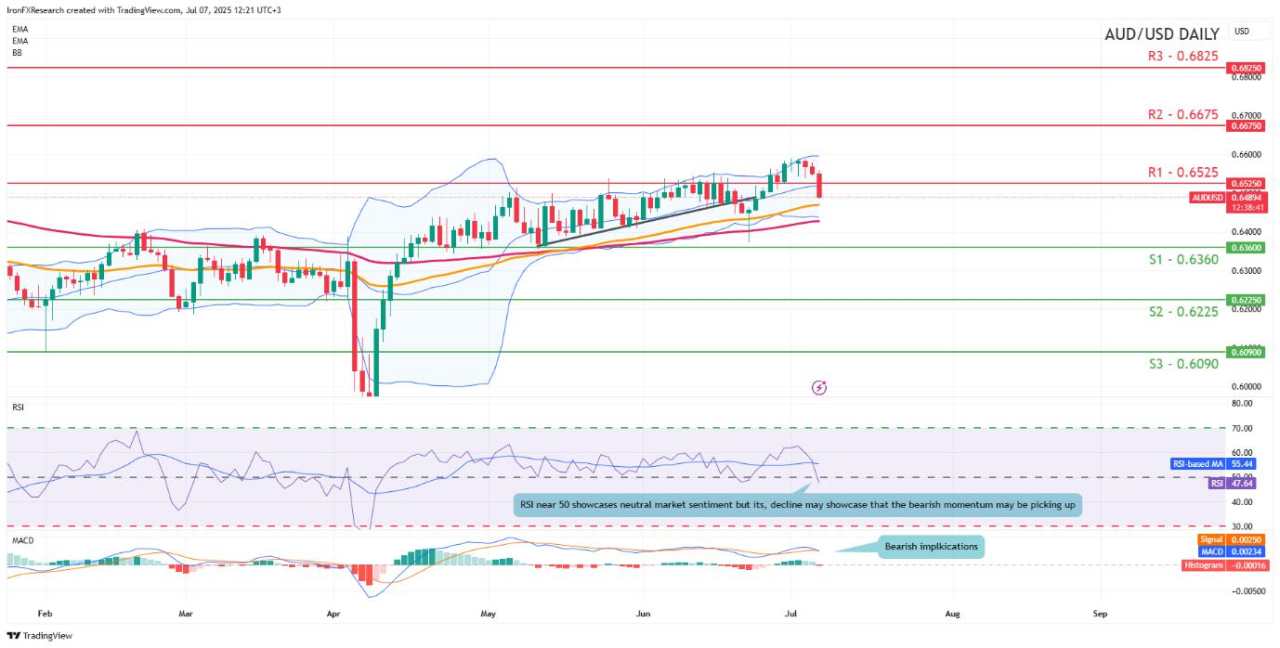
- Support: 0.6360 (S1), 0.6225 (S2), 0.6090 (S3).
- Resistance: 0.6525 (R1), 0.6675 (R2), 0.6825 (R3).
AUD/USD appears to be currently moving in a downwards fashion after breaking below our resistance turned to support now turned to resistance again at the 0.6525 (R1) level. However, we opt for a predominantly sideways bias for the pair as long as it remains confined between our 0.6360 (S1) support level and our 0.6525 (R1) resistance line. On the other hand, we would immediately switch our sideways bias in favour of a bearish outlook should the pair clearly break below the 0.6360 (S1) support level with the next possible target for the bears being the 0.6225 (S2) support line. Lastly, for a bullish outlook we would require a clear break above our 0.6525 (R1) resistance line with the next possible target for the bulls being the 0.6675 (R2) resistance level. On another note we would like to note that the RBA’s interest rate decision is set to occur in tomorrow’s Asian session with the majority of market participants currently anticipating the bank to cut rates. In turn our attention turns to the bank’s accompanying statement where should it be perceived as dovish in nature it could weigh on the AUD and vice versa. In conclusion this particular pair may see heightened volatility during tomorrow’s Asian session.
XAU/USD daily chart
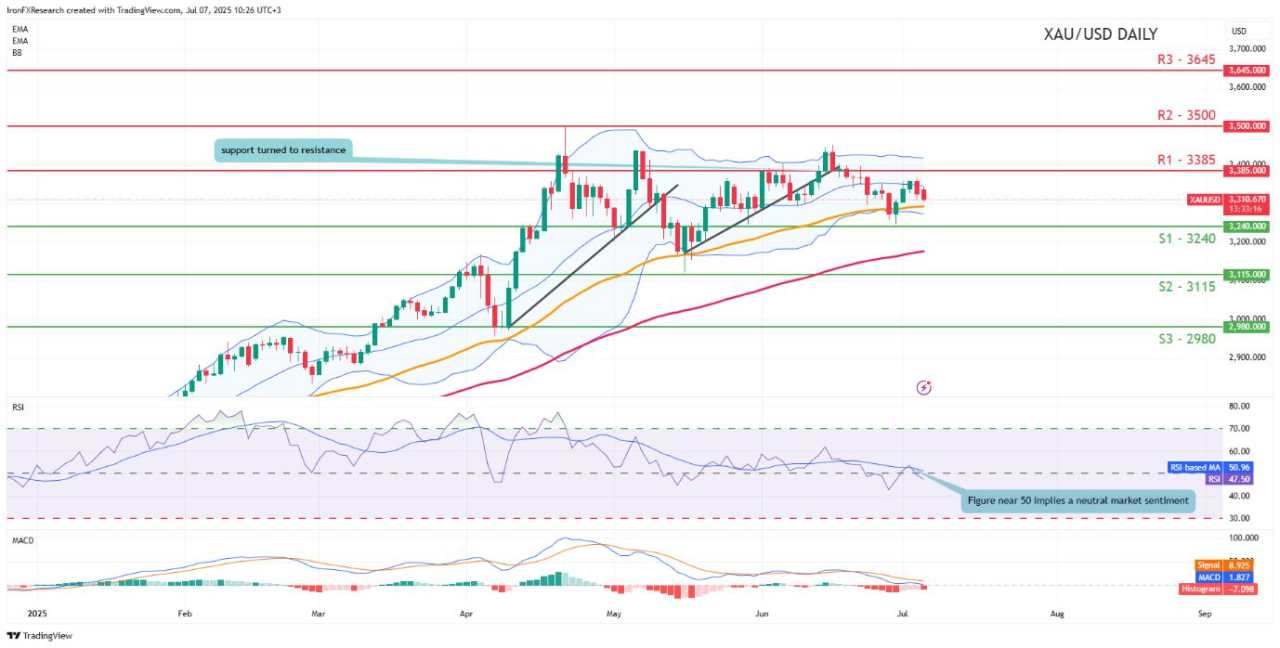
- Support: 3240 (S1), 3115 (S2), 2980 (S3).
- Resistance: 3385 (R1), 3500 (R2), 3645 (R3).
XAU/USD appears to be moving in a predominantly sideways fashion. We opt for a sideways bias for the precious metal’s price and support our case is the RSI indicator below our chart which currently registers a figure near 50, implying a neutral market sentiment. For our sideways bias to be maintained we would require gold’s price to remain confined between the 3240 (S1) support level and the 3385 (R1) resistance line. On the other hand, for a bearish outlook we would require a clear break below the 3240 (S1) support level with the next possible target for the bears being the 3115 (S2) support line. Lastly, for a bullish outlook we would require a clear break above the 3385 (R1) resistance line with the next possible target for the bulls being the 3500 (R2) resistance ceiling.
WTICash daily chart
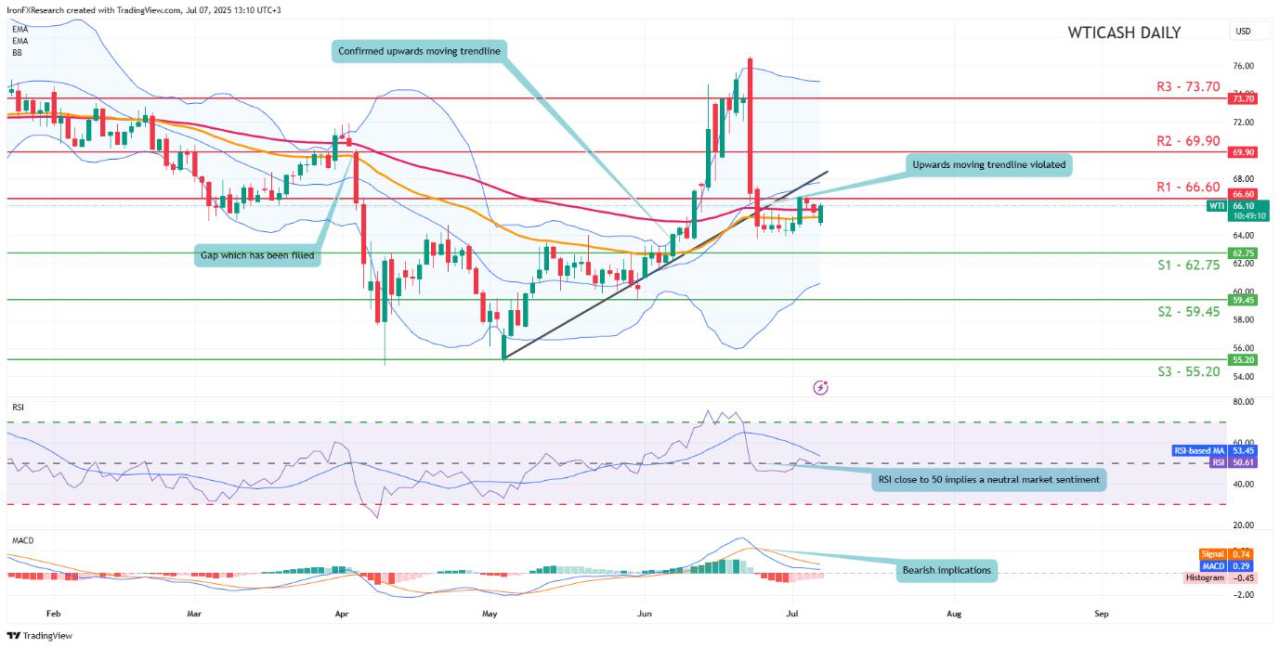
- Support: 62.75 (S1), 59.45 (S2), 55.20 (S3).
- Resistance: 66.60 (R1), 69.90 (R2), 73.70 (R3).
WTICash appears to be moving in a sideways fashion. We opt for a sideways bias for the commodity’s price and supporting our case is the RSI indicator below our chart which currently registers a figure near 50, implying a neutral market sentiment. For our sideways bias to be maintained we would require the commodity’s price to remain confined between our 62.75 (S1) support level and our 66.60 (R1) resistance line. On the other hand, for a bearish outlook we would require a clear break below our 62.75 (S1) support level with the next possible target for the bears being the 59.45 (S2) support base. Lastly, for a bullish outlook we would require a clear break above our 66.60 (R1) resistance line if not also our 69.90 (R2) resistance level with the next possible target for the bulls being the 73.70 (R3) resistance ceiling.
Được in lại từ FXStreet, bản quyền được giữ lại bởi tác giả gốc.
Tuyên bố miễn trừ trách nhiệm: Quan điểm được trình bày hoàn toàn là của tác giả và không đại diện cho quan điểm chính thức của Followme. Followme không chịu trách nhiệm về tính chính xác, đầy đủ hoặc độ tin cậy của thông tin được cung cấp và không chịu trách nhiệm cho bất kỳ hành động nào được thực hiện dựa trên nội dung, trừ khi được nêu rõ bằng văn bản.
Website Cộng đồng Giao Dịch FOLLOWME: www.followme.asia


Tải thất bại ()