USD: Sept '25 is Down at 97.110.
Energies: Aug '25 Crude is Down at 67.84.
Financials: The Sep '25 30 Year T-Bond is Lower by 9 ticks and trading at 112.30.
Indices: The Jun '25 S&P 500 emini ES contract is 32 ticks Higher and trading at 6284.00.
Gold: The Aug'25 Gold contract is trading Down at 3334.90.
Initial conclusion
This is not a correlated market. The USD is Down and Crude is Down which is not normal, and the 30 Year T-Bond is trading Lower. The Financials should always correlate with the US dollar such that if the dollar is Higher, then the bonds should follow and vice-versa. The S&P is Higher and Crude is trading Down which is correlated. Gold is trading Lower which is not correlated with the US dollar trading Down. I tend to believe that Gold has an inverse relationship with the US Dollar as when the US Dollar is down, Gold tends to rise in value and vice-versa. Think of it as a seesaw, when one is up the other should be down. I point this out to you to make you aware that when we don't have a correlated market, it means something is wrong. As traders you need to be aware of this and proceed with your eyes wide open. Asia traded Mixed. All of Europe is trading Higher with the exception of the Paris exchange.
Possible challenges to traders
- NFIB Small Business Index is out at 6 AM EST. This is Major.
- Consumer Credit is out at 3 PM EST. This is Major.
Traders, please note that we've changed the Bond instrument from the 10 Year (ZN) to the 2 Year (ZT). They work exactly the same.
We've elected to switch gears a bit and show correlation between the 2-year Treasury notes (ZT) and the S&P futures contract. The YM contract is the Dow Jones Industrial Average, and the purpose is to show reverse correlation between the two instruments. Remember it's likened to a seesaw, when up goes up the other should go down and vice versa.
Yesterday the ZT leaped Higher at around 10:30 AM EST with no eco news pending. The Dow dived Lower at the same time. Look at the charts below and you'll see a pattern for both assets. The Dow dived Lower at 10:30 AM EST and the ZT climbed Higher at around the same time. These charts represent the newest version of Bar Charts, and I've changed the timeframe to a 15-minute chart to display better. This represented a Long opportunity on the 2-year note, as a trader you could have netted about 20 plus ticks per contract on this trade. Each tick is worth $6.25. Please note: the front month for ZT is now Sep '25 and the Dow is now Sep '25. I've changed the format to filled Candlesticks (not hollow) such that it may be more apparent and visible.
Charts courtesy of barCharts
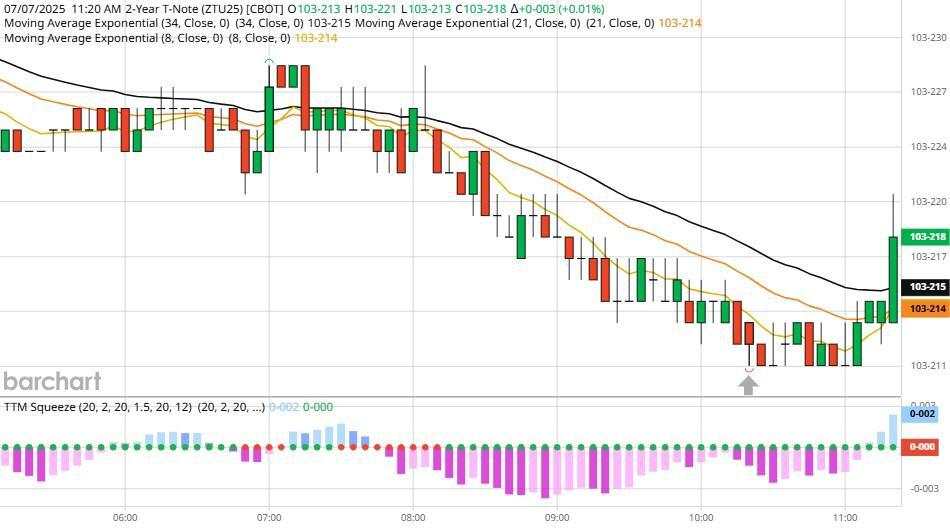
ZT -Sep 25 - 7/07/25
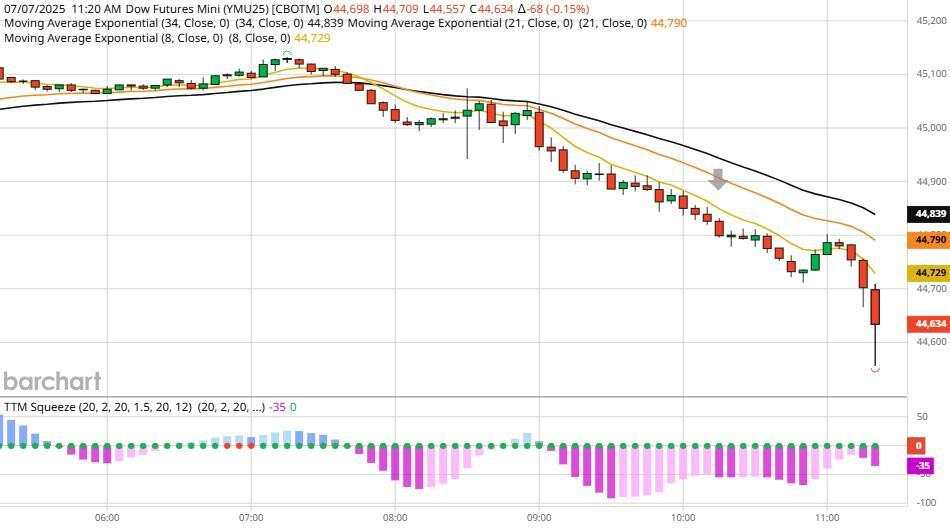
Dow - Sep 2025- 7/07/25
Bias
Yesterday we gave the markets a Mixed or Neutral bias as it was the first back from a 3-day holiday weekend and the markets are always volatile after a major holiday. Yesterday was no exception and the markets traded Lower across all indices. The Dow dropped over 500 points and the other indices closed Lower as well. Today our bias is to the Upside.
Could this change? Of Course. Remember anything can happen in a volatile market.
Commentary
Yesterday was the first day back from a major holiday in the United States and the markets all traded Lower. Will this change today? As in all things only time will tell.
Được in lại từ FXStreet, bản quyền được giữ lại bởi tác giả gốc.
Tuyên bố miễn trừ trách nhiệm: Nội dung trên chỉ đại diện cho quan điểm của tác giả hoặc khách mời. Nó không đại diện cho quan điểm hoặc lập trường của FOLLOWME và không có nghĩa là FOLLOWME đồng ý với tuyên bố hoặc mô tả của họ, cũng không cấu thành bất kỳ lời khuyên đầu tư nào. Đối với tất cả các hành động do khách truy cập thực hiện dựa trên thông tin do cộng đồng FOLLOWME cung cấp, cộng đồng không chịu bất kỳ hình thức trách nhiệm nào trừ khi có cam kết rõ ràng bằng văn bản.
Website Cộng đồng Giao Dịch FOLLOWME: www.followme.asia


Tải thất bại ()