S2N spotlight
I am an old-fashioned guy. When it comes to valuation, you cannot remain overvalued forever. In the same way, you cannot remain undervalued forever. Valuation is a dance between forces of optimism and pessimism sprinkled with a variety of other emotions, for example, fear and greed.
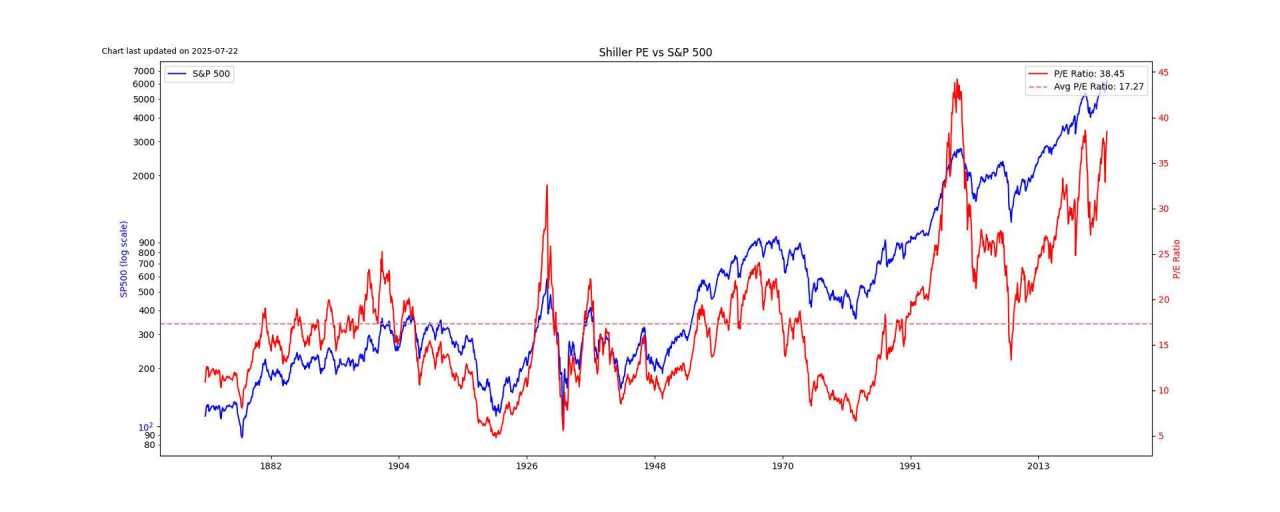
I have written before that the Shiller PE is my go-to valuation metric; you can see over more than 150 years the correlation between this ratio and the S&P 500 is pretty tight. The current reading of 38.45 is on the verge of becoming the second highest reading of all time. With this in mind, I decided to see if I could make a quantitative argument for the Shiller PE ratio to come down. This is what I came up with.
The choice of model I used for the forecast was largely driven by the fact that I assumed the Shiller PE ratio was mean reverting. It turns out that my assumption was off, but the choice of model still fit the brief.
The best way to test for mean reversion is to use the Advanced Dickey-Fuller statistical test. The ADF statistic is -1.829166 with a p-value of 0.366081, in plain English. The Shiller PE ratio is not mean reverting.
Despite that, we forecast the next 1 and 5 years using an AR (auto regressive) statistical model.
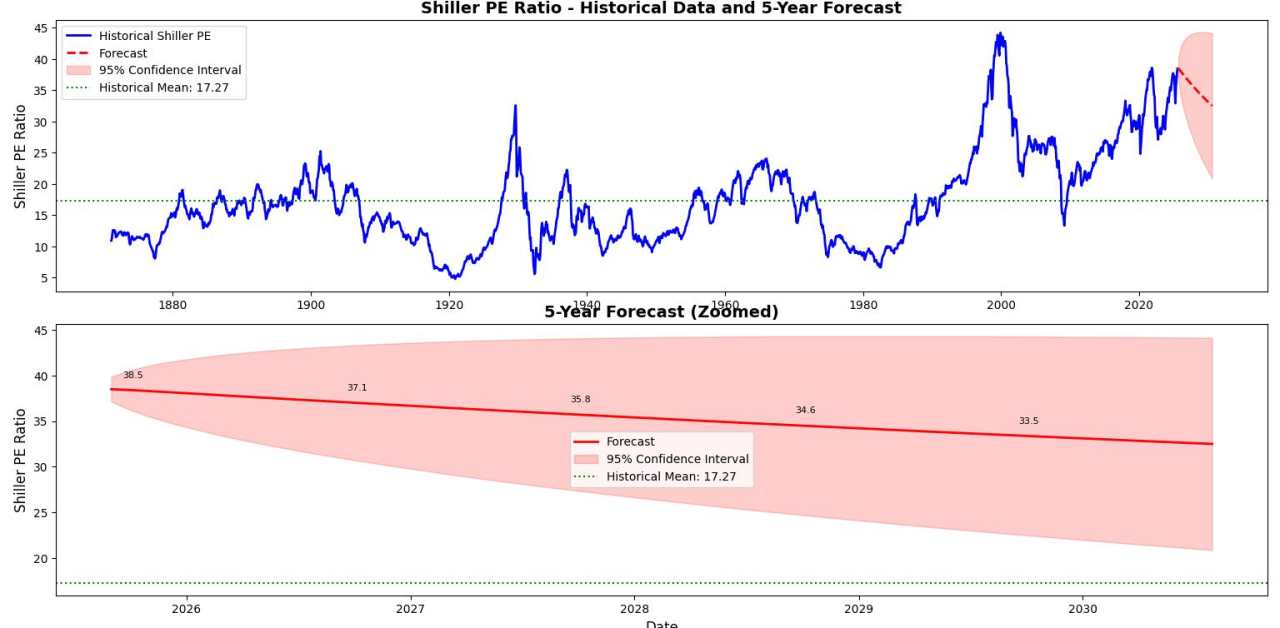
As you can see pretty clearly, the forecast for the PE ratio over the next 5 years is down. In fact, I can even provide some statistics:
- Probability of PE being below current value (38.45) in 1 year: 95.9%.
- Probability of PE being below current value (38.45) in 5 years: 100.0%.
What this means:
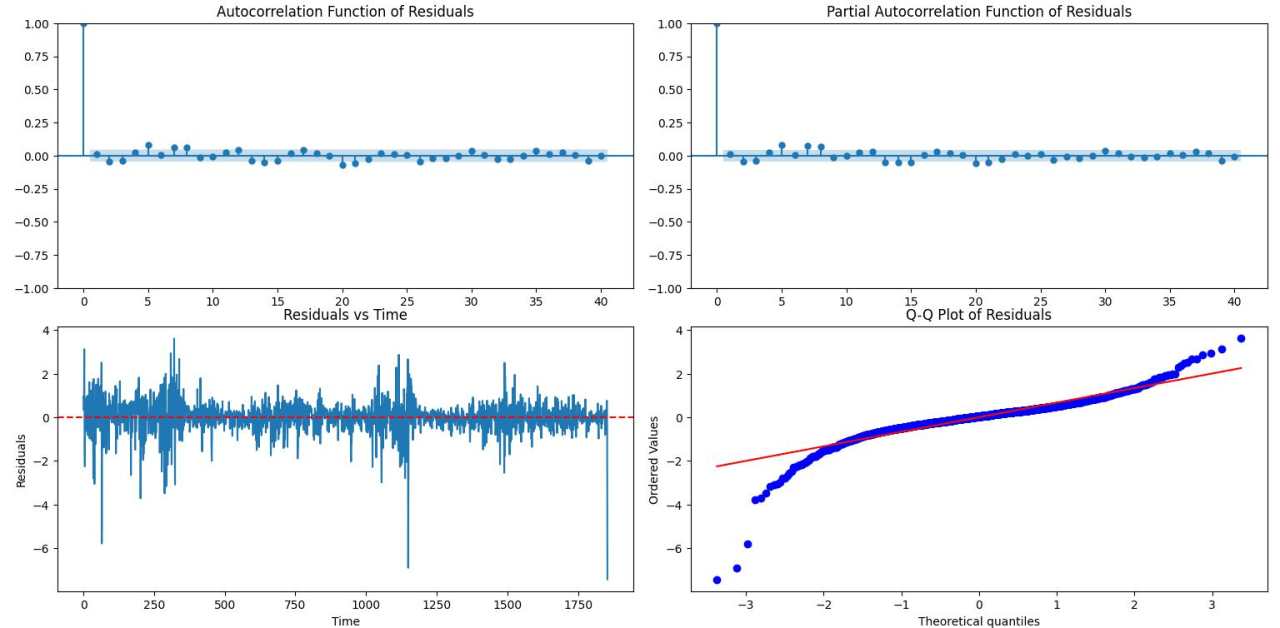
- The model captures trends well (Ljung-Box p=0.61 shows no autocorrelation).
- Underestimates extremes (Jarque-Bera p=0.00, fat tails with kurtosis 14.33).
- Volatility varies over time (heteroskedasticity p=0.00, H=2.91).
The model is good at capturing trends but underestimates the risk of extreme PE movements. This is common in financial data—the real world is more volatile than normal distributions suggest! This is why our forecast shows a gradual decline, but in reality PE movements tend to be much more dramatic.
We can see there is a tendency for markets to remain over- or undervalued for extended periods of time with the Residuals vs. Time chart, which is why it is so difficult to time valuation-driven models. However, I remain steadfast in my belief that a US market correction is the high-probability trade. The best way to benefit is by purchasing undervalued tail derivatives.
S2N observations
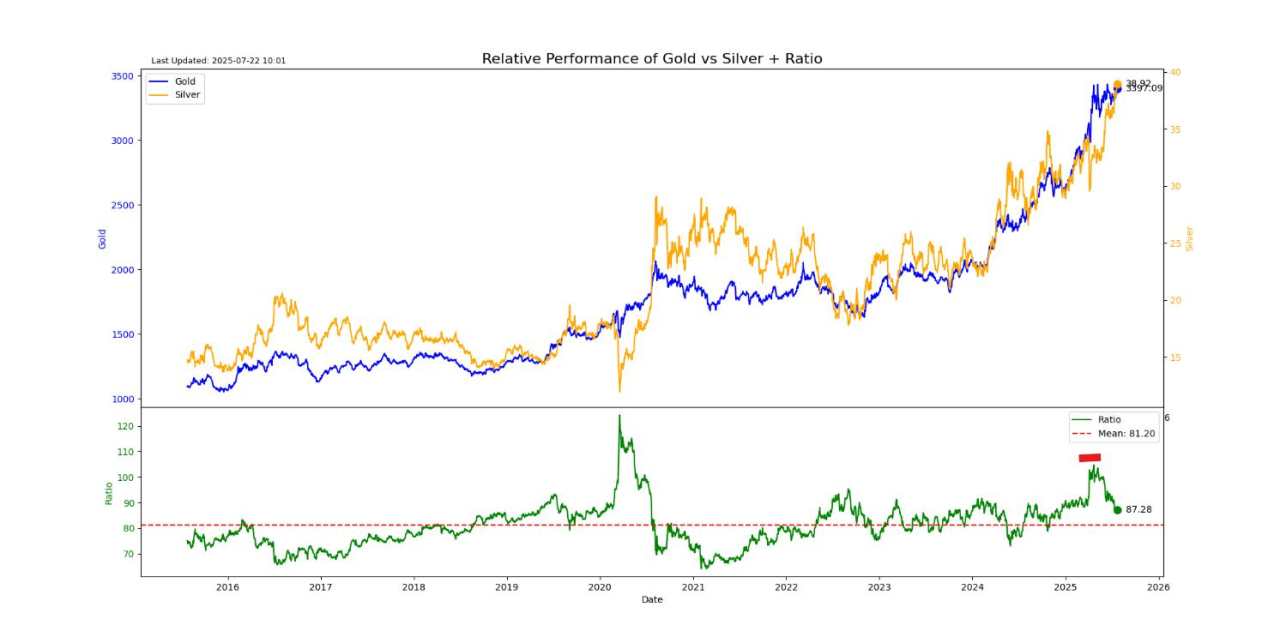
Silver has been running hot the last couple of months, as you can see in this chart.
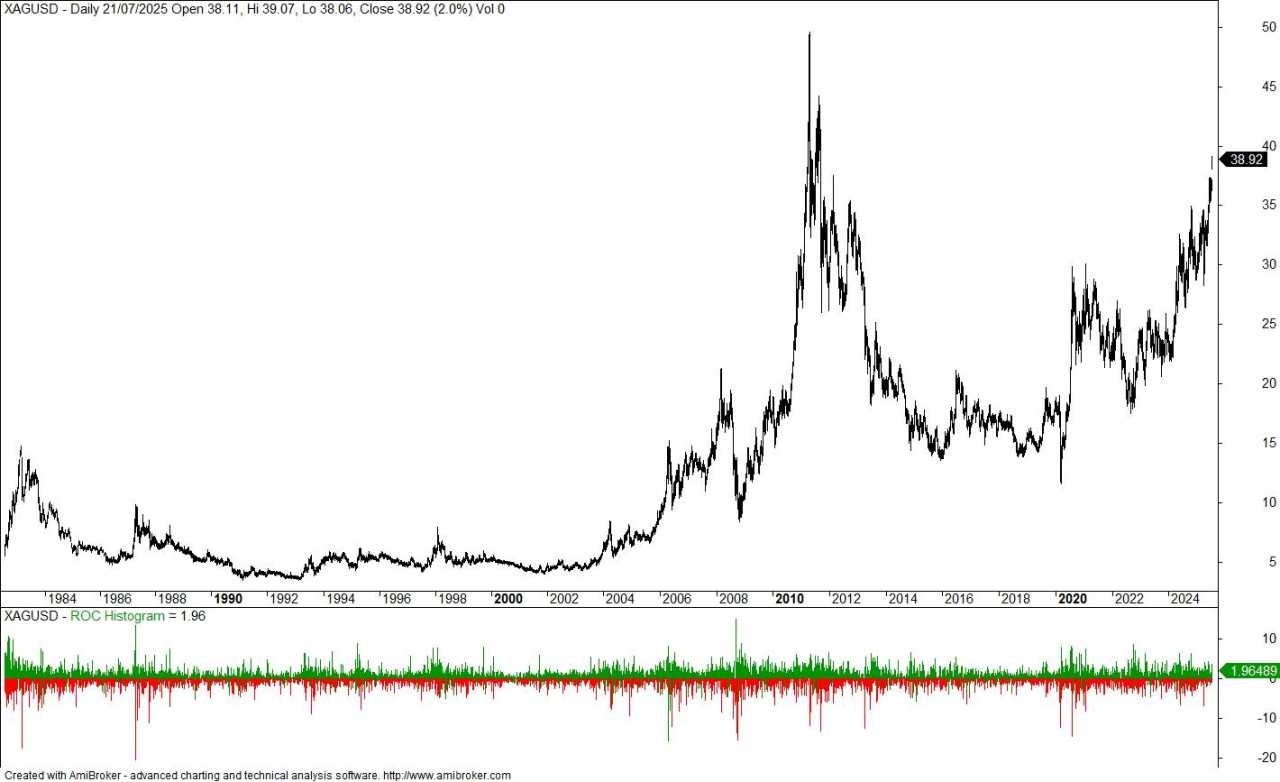
On the 17th of March I recommended silver over gold as the better relative trade. I made the call, which I marked in red below, almost exactly where the green ratio topped and silver started outperforming. I think the trade has done enough, and therefore I would exit this relative trade now.
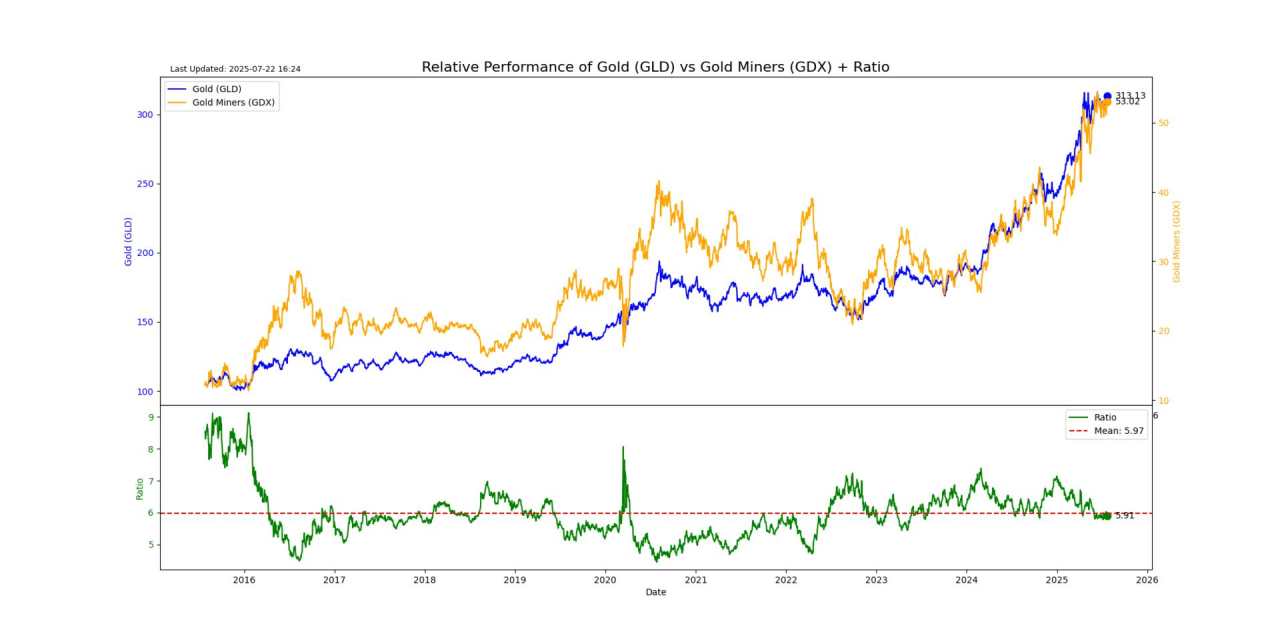
To show that I am not cherry-picking, in that letter in March I also said to trade gold miners versus gold. It worked out but not nearly as well as the silver trade.
S2N screener alert
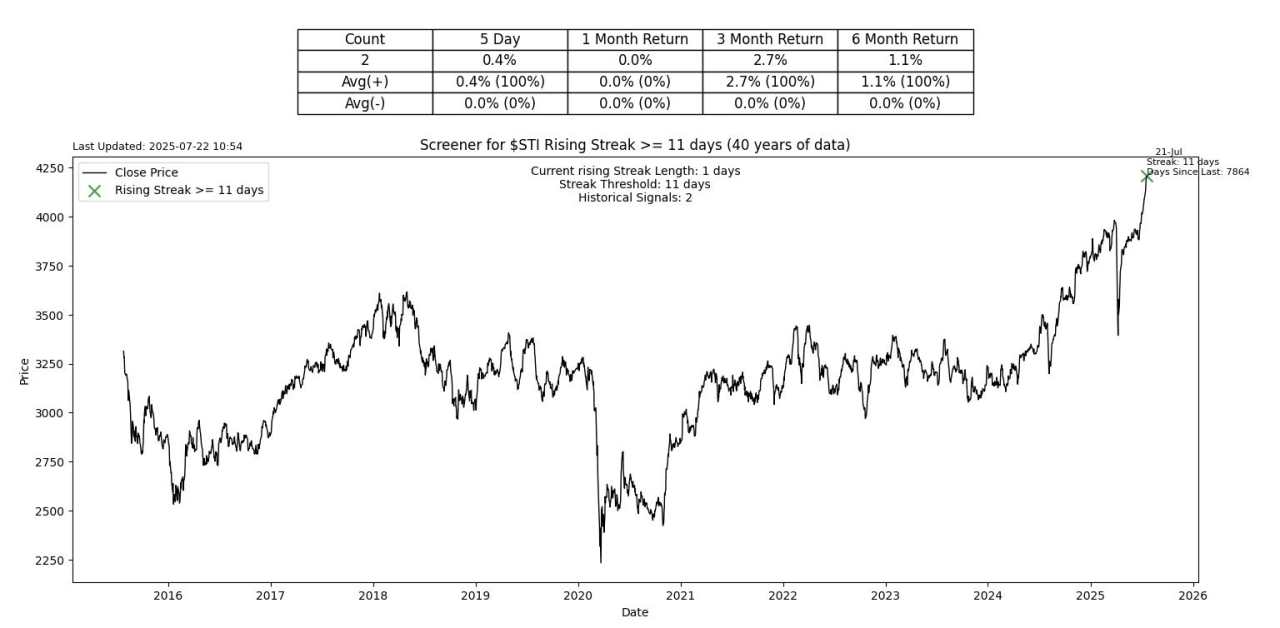
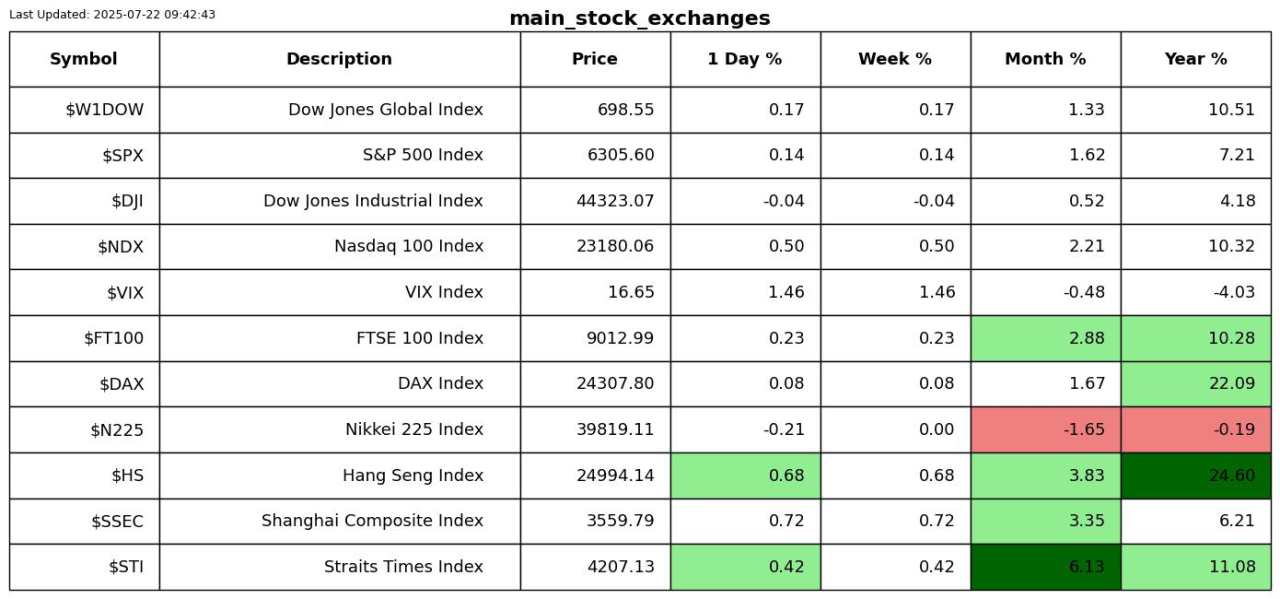
The Singapore Straits Times Index was up 11 days in a row, its second-longest streak in history.
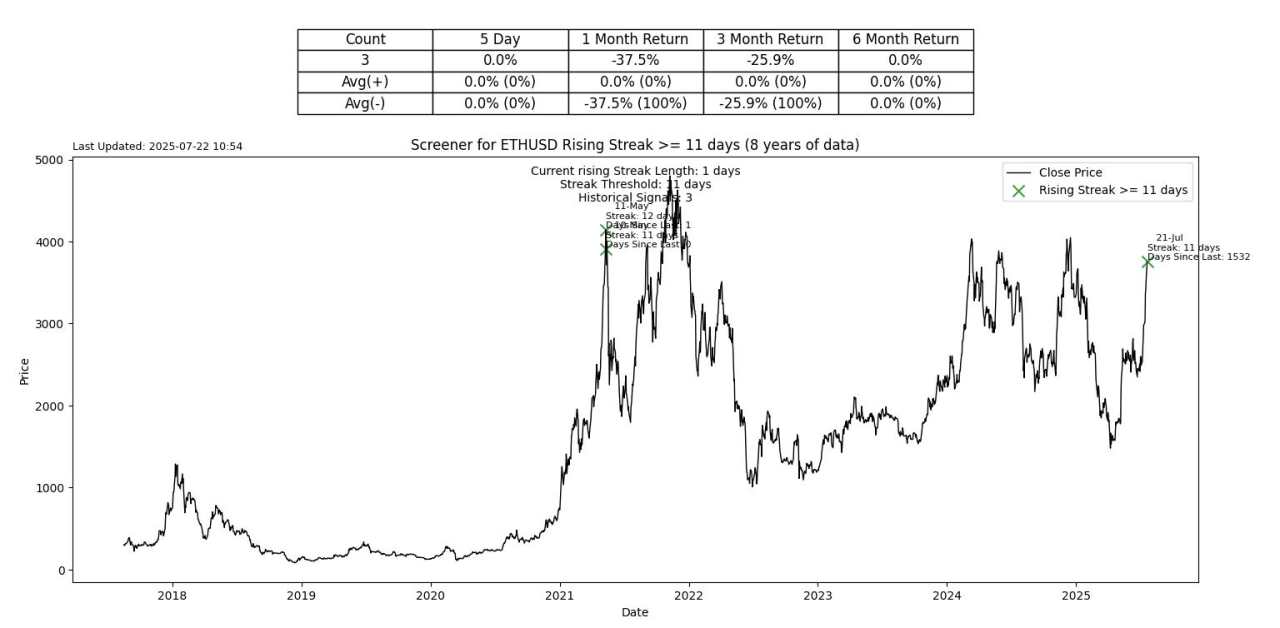
Ethereum was up 11 days in a row, its 3rd longest streak in history.
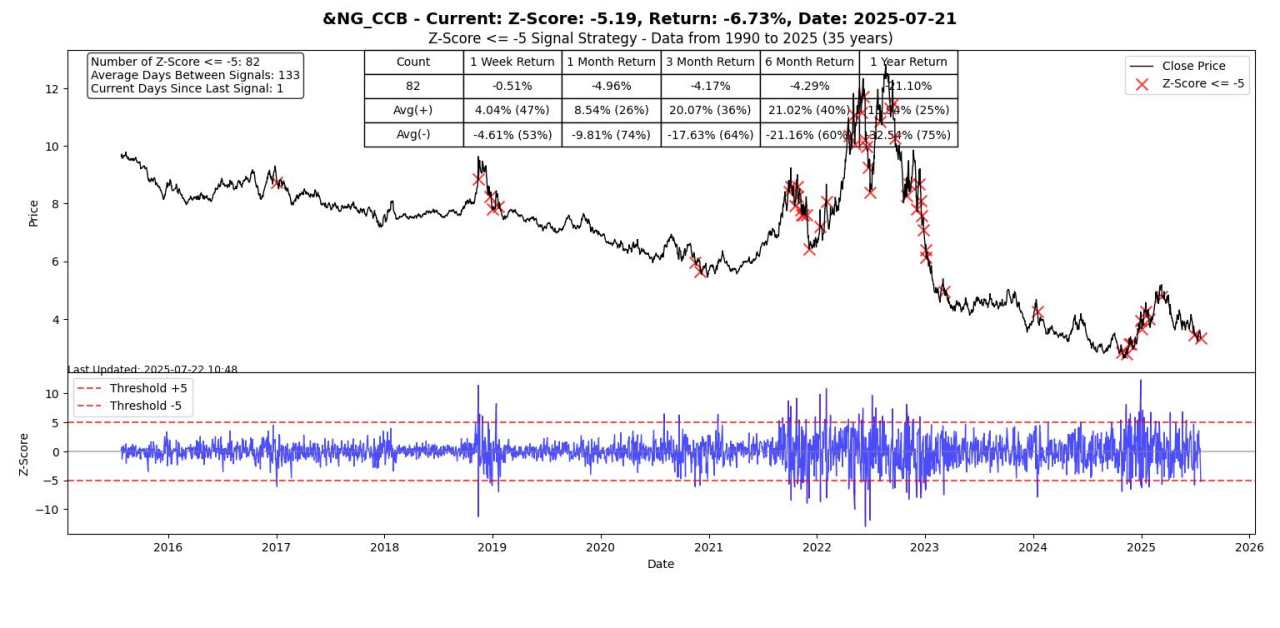
Natural Gas continues its volatile price action with a very large 5 sigma drop. Historical probabilities suggest continued weakness. Based on the chart below, I would think this is a great short opportunity.
S2N performance review
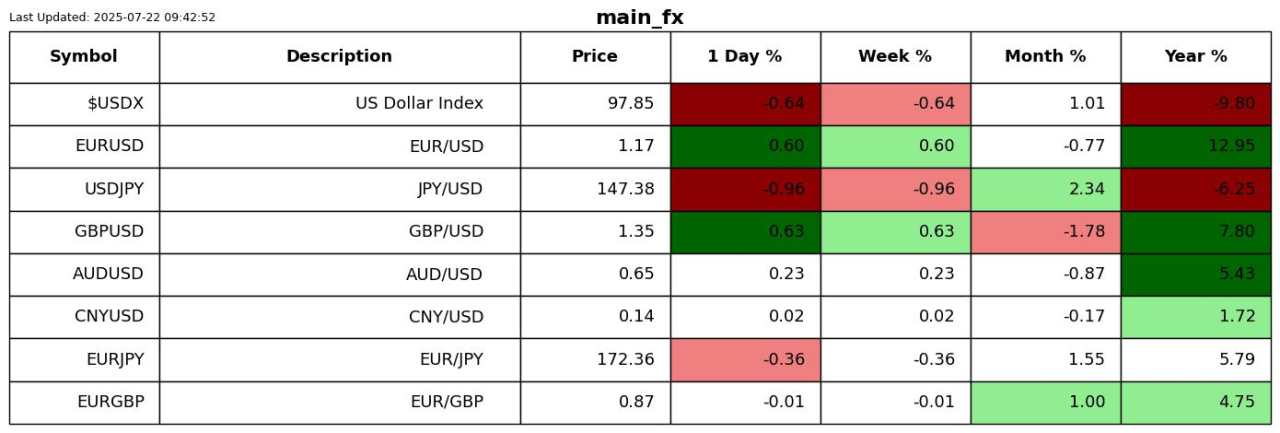
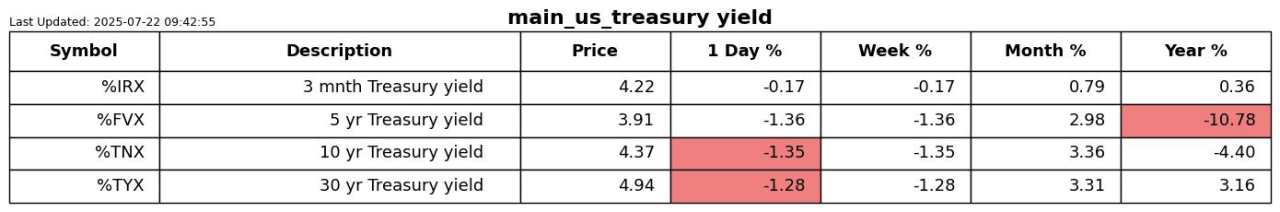
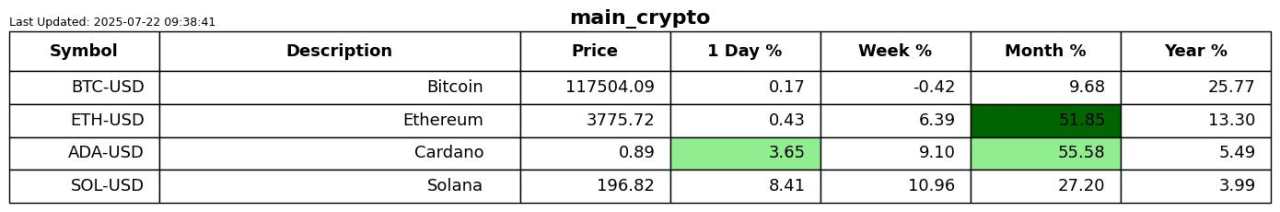
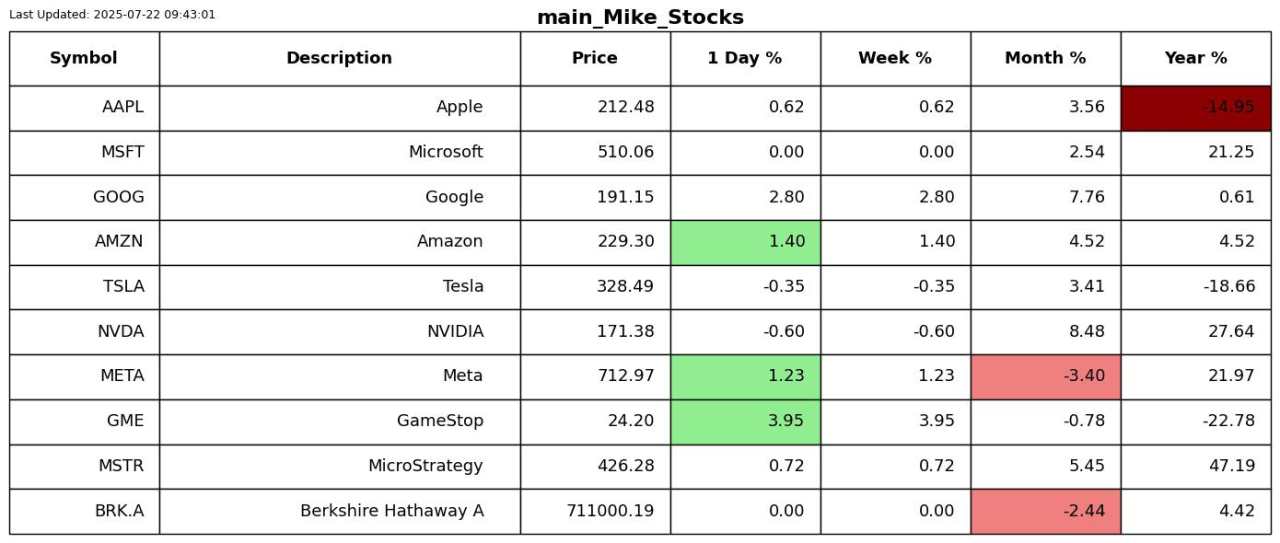
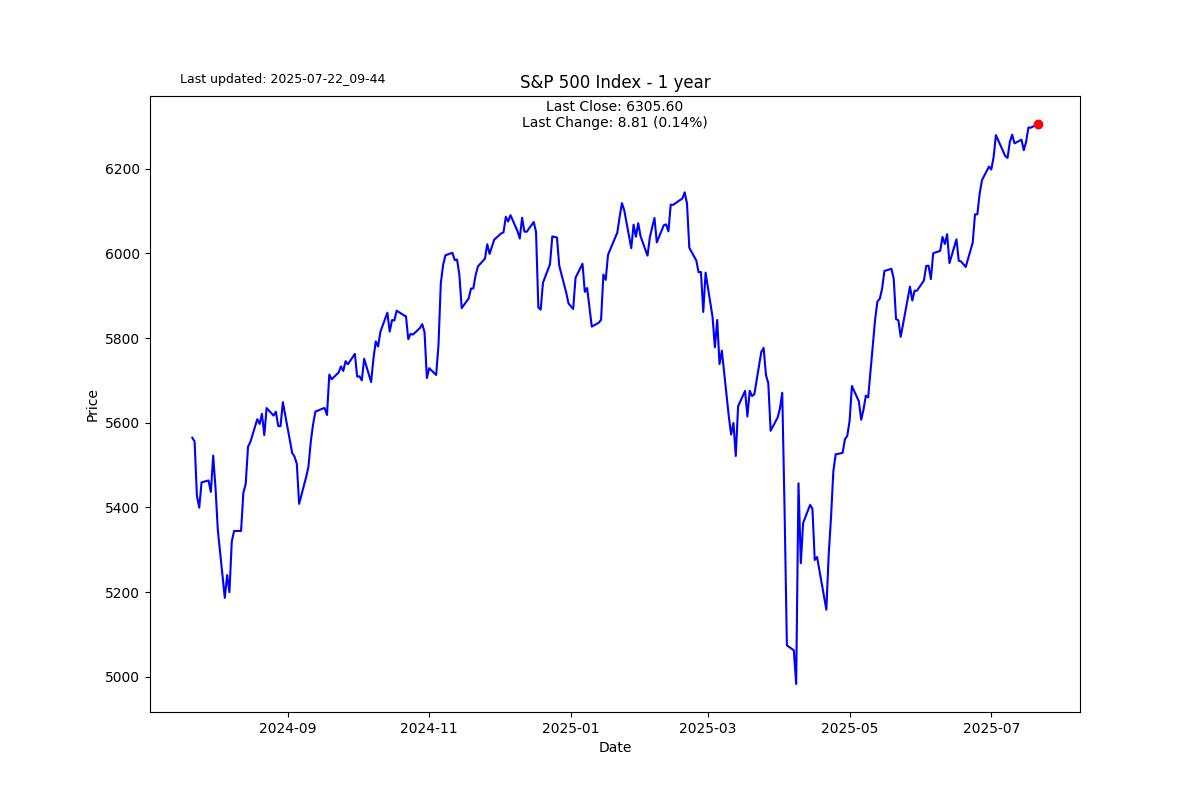
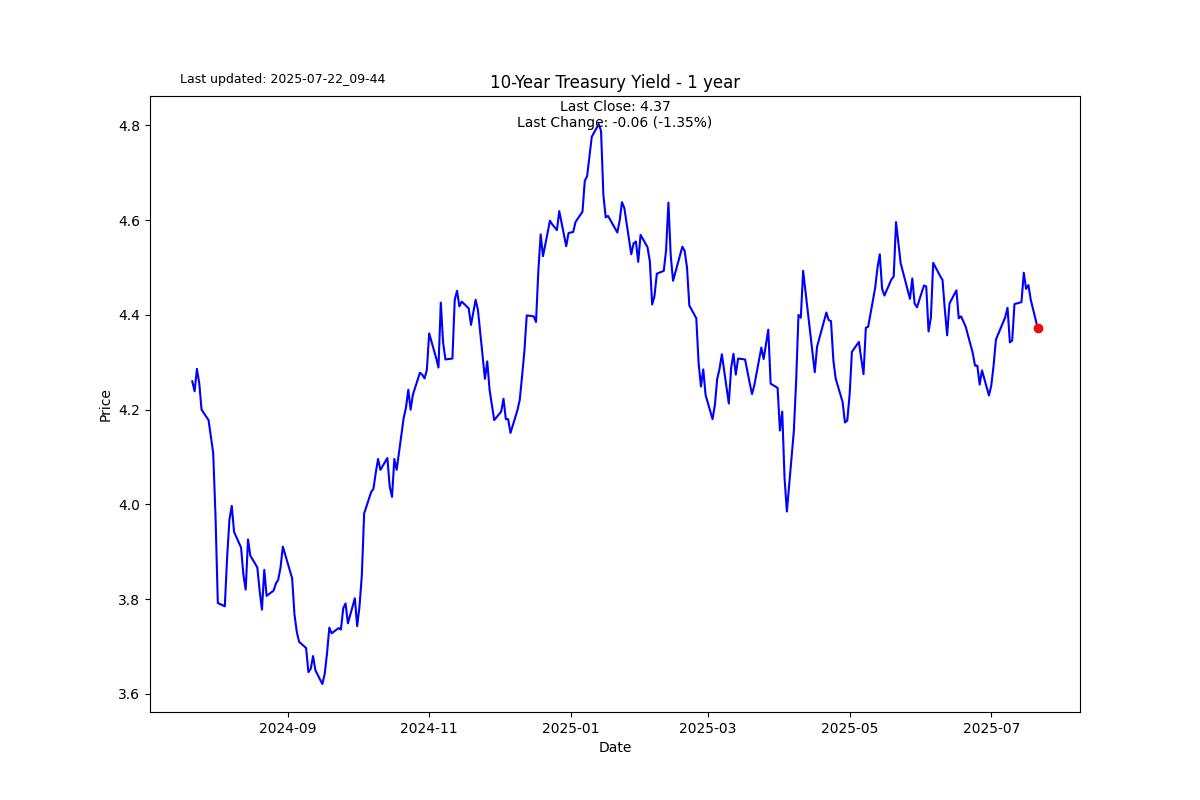
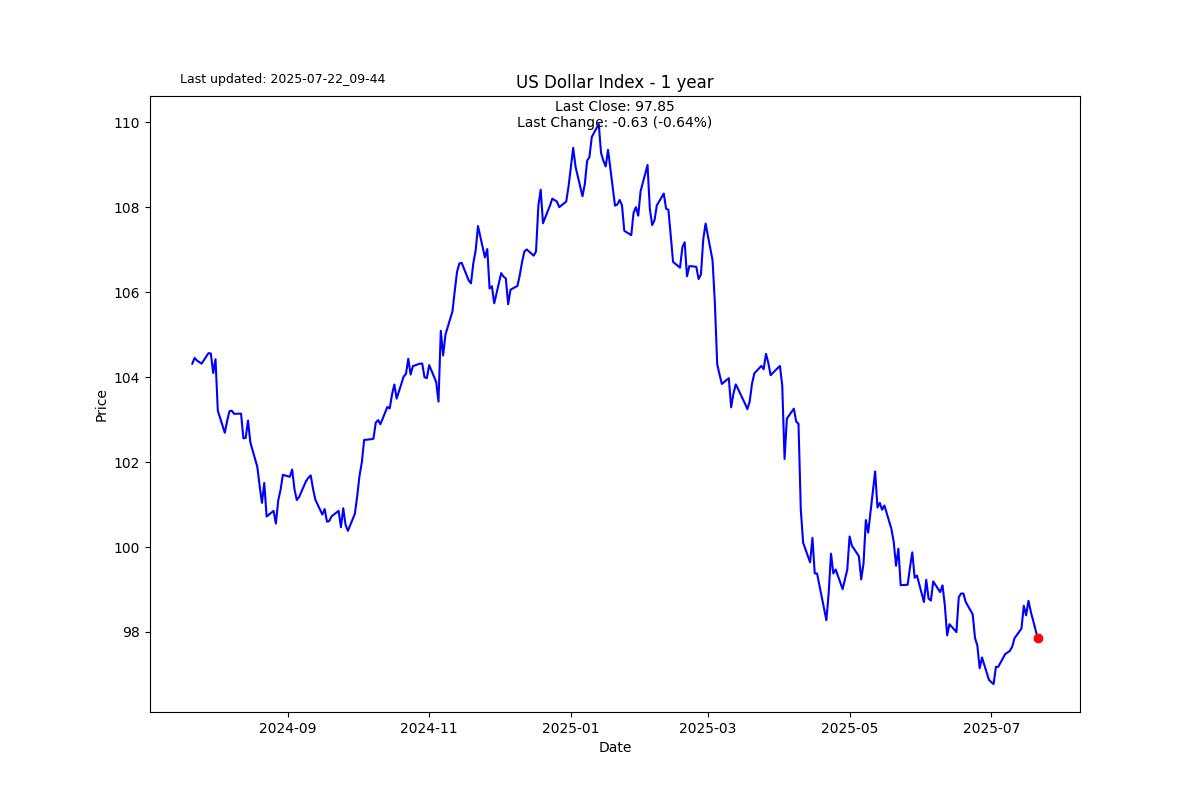
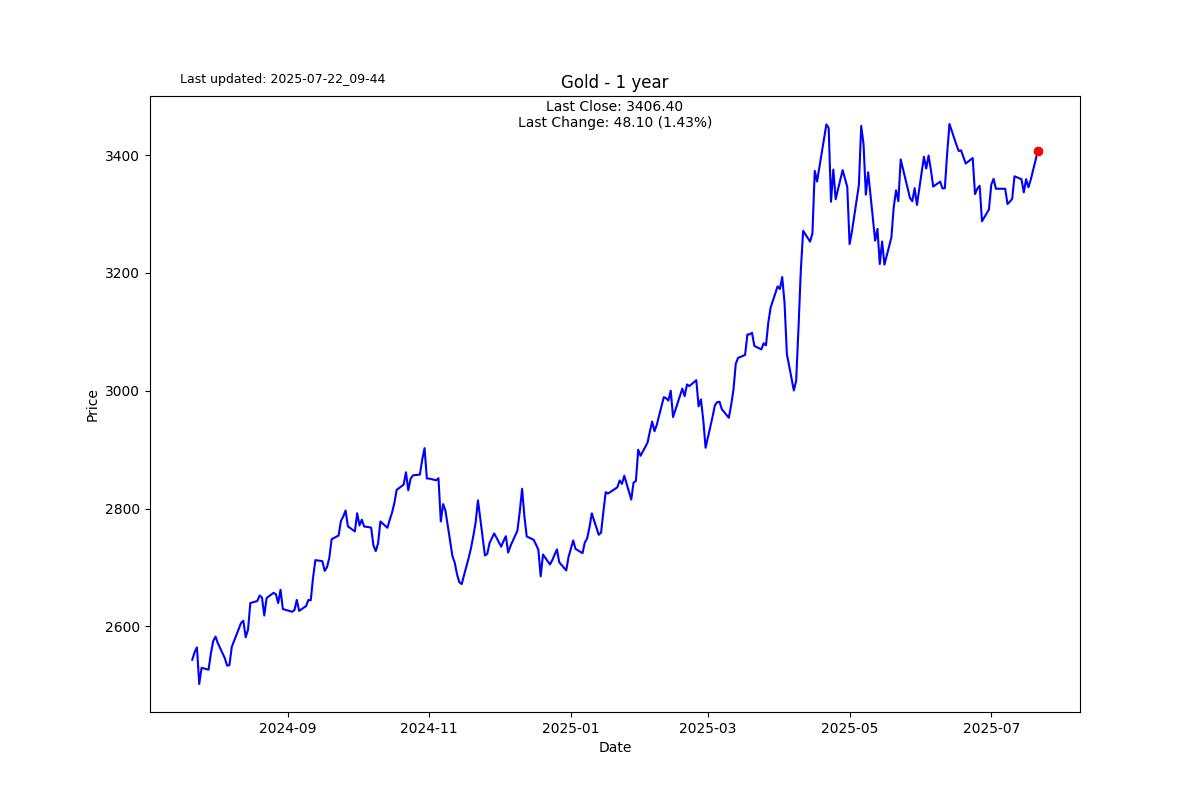
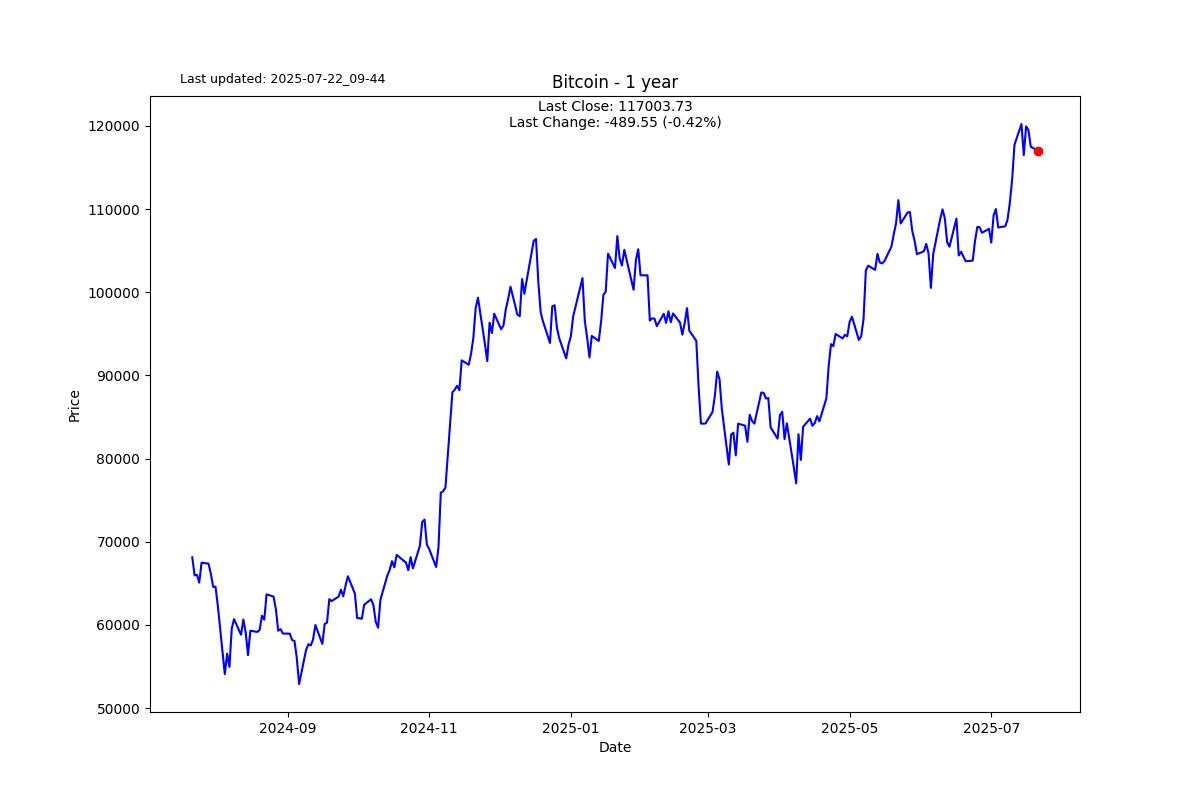
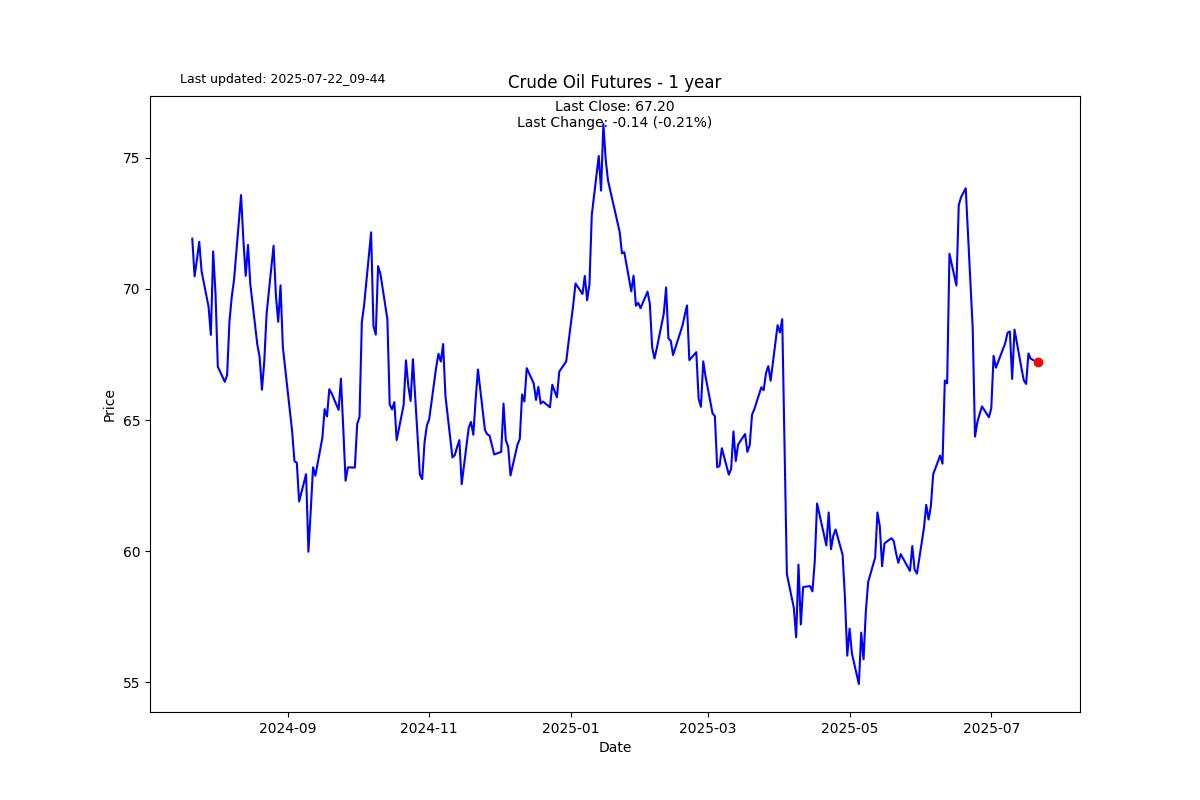
S2N chart gallery
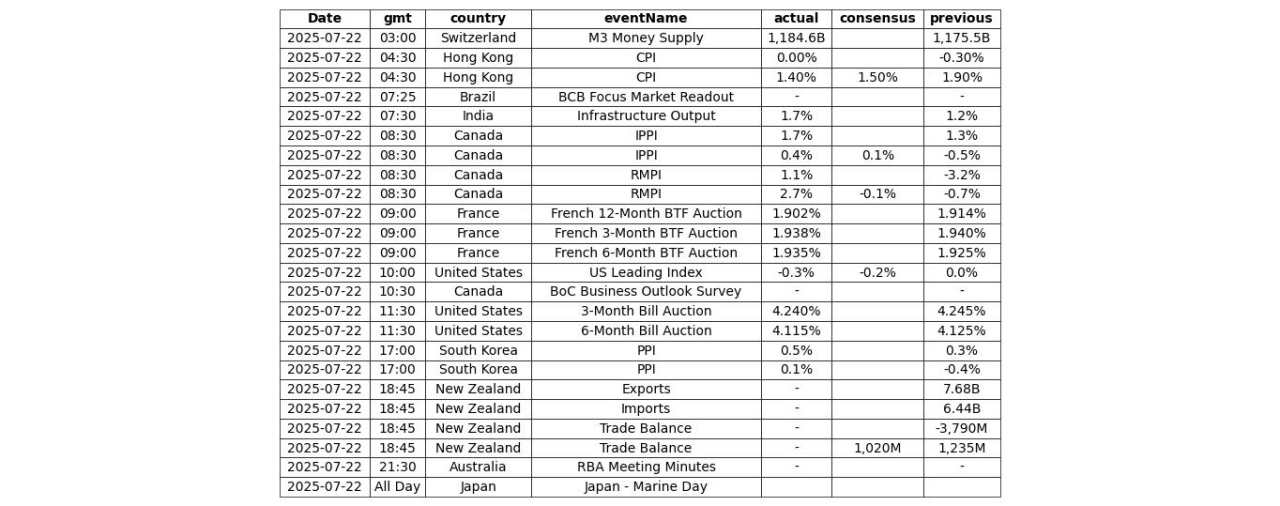
S2N news today
Được in lại từ FXStreet, bản quyền được giữ lại bởi tác giả gốc.
Tuyên bố miễn trừ trách nhiệm: Quan điểm được trình bày hoàn toàn là của tác giả và không đại diện cho quan điểm chính thức của Followme. Followme không chịu trách nhiệm về tính chính xác, đầy đủ hoặc độ tin cậy của thông tin được cung cấp và không chịu trách nhiệm cho bất kỳ hành động nào được thực hiện dựa trên nội dung, trừ khi được nêu rõ bằng văn bản.
Website Cộng đồng Giao Dịch FOLLOWME: www.followme.asia


Tải thất bại ()