In this technical article we’re going to look at the Elliott Wave charts of EURUSD forex pair published in members area of the website. The pair has recently given us Double Three pull back and found buyers again precisely at the equal legs area as we expected. In the following text, we’ll explain the Elliott Wave count.
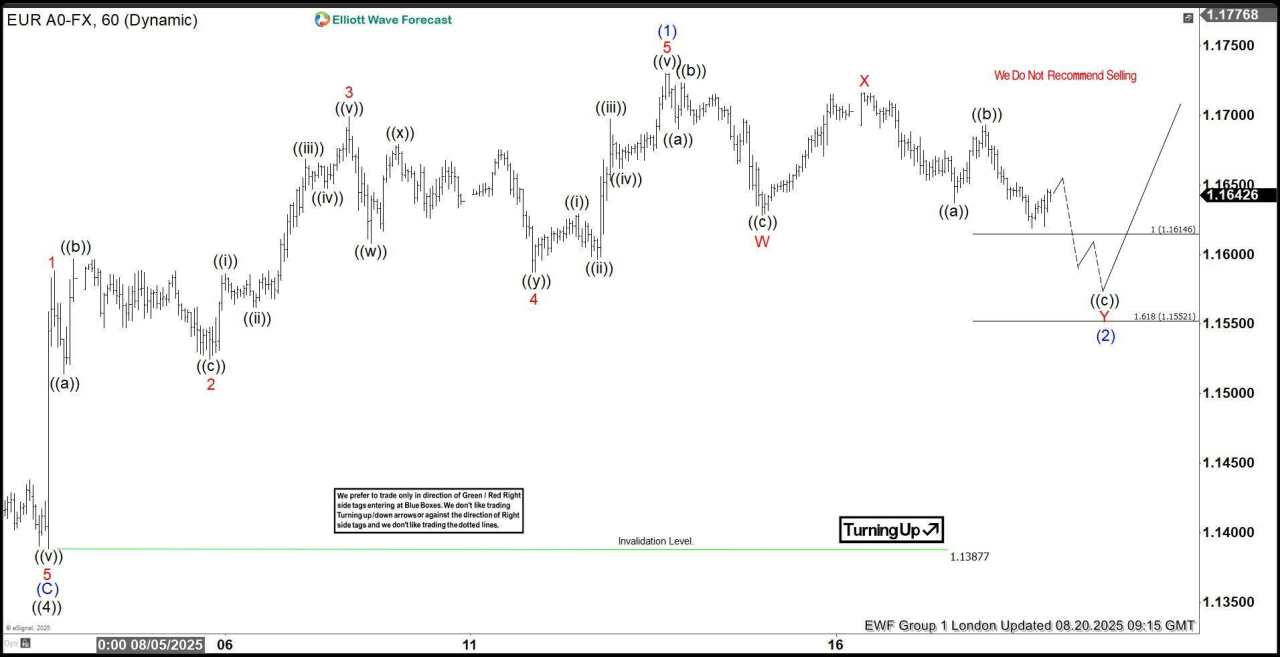
EUR/USD Elliott Wave one-hour chart 08.20.2025
EURUSD is currently developing an intraday three-wave pullback from recent highs. Our members know how to identify potential reversal zones using the Equal Legs technique — in this case, the ideal support area comes in at 1.16146-1.15521. The pair can see more downside in near term. As long as price holds within this region, we expect buyers to step in and rally to resume.
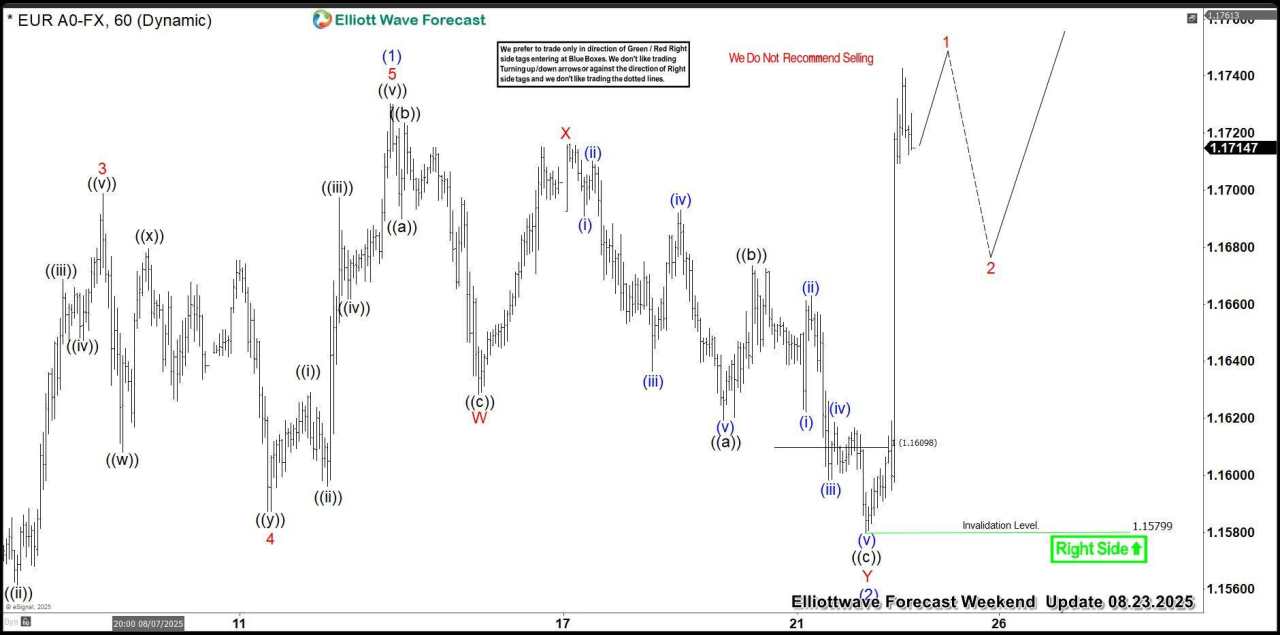
EUR/USD Elliott Wave one-hour chart 08.20.2025
The pair has reached our target area and found buyers as expected. EURUSD made strong rally from the buyers zone and completed pull back at the 1.15799 low. We do not recommend selling the pair at this stage and favor the long side. 1.15799 is the key low for proposed short term view. While above that low, next leg up can be in progress.
Được in lại từ FXStreet, bản quyền được giữ lại bởi tác giả gốc.
Tuyên bố miễn trừ trách nhiệm: Quan điểm được trình bày hoàn toàn là của tác giả và không đại diện cho quan điểm chính thức của Followme. Followme không chịu trách nhiệm về tính chính xác, đầy đủ hoặc độ tin cậy của thông tin được cung cấp và không chịu trách nhiệm cho bất kỳ hành động nào được thực hiện dựa trên nội dung, trừ khi được nêu rõ bằng văn bản.


Tải thất bại ()