The GBP/USD pair advanced to 1.3509 on Thursday. The primary catalyst for traders was the latest UK Producer Price Index (PPI) data.
UK producer inflation accelerated to a two-year high, reaching 1.9% year-on-year (y/y) in June. This follows a previous report showing that consumer price inflation (CPI) rose to 3.8% y/y in July, an 18-month peak. Despite these inflationary pressures, money markets are currently pricing in only a 40% probability of a BoE rate cut by the end of the year.
Despite near-term volatility, sterling remains approximately 1.5% higher against the US dollar for August. This appreciation has been driven by diminishing expectations of an imminent BoE rate cut and a series of robust macroeconomic data releases. The hawkish sentiment was underscored by comments from Catherine Mann, a member of the BoE's Monetary Policy Committee, who stated that policy must remain unchanged to anchor inflation effectively.
In summary, a hawkish repricing of BoE interest rate expectations is providing short-term momentum for the pound.
Technical analysis: GBP/USD
Four-hour chart
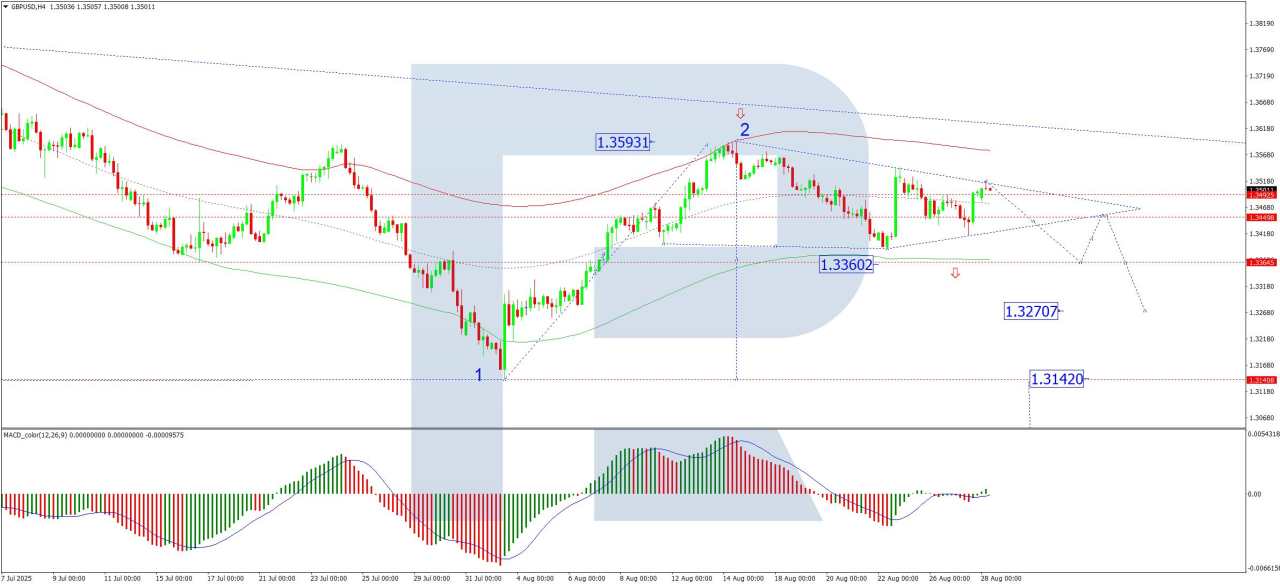
On the H4 chart, the GBP/USD pair completed a downward impulse wave to the 1.3420 level, followed by a corrective bounce to 1.3515. The market continues to develop a consolidation range around the 1.3455 level. The primary scenario for today is a resumption of the downward wave towards the 1.3360 support. A decisive break below this level would open the potential for a further decline towards the next downside targets of 1.3270 and 1.3140. This bearish outlook is technically supported by the MACD indicator, whose signal line remains below zero and is pointing sharply lower.
One-hour chart
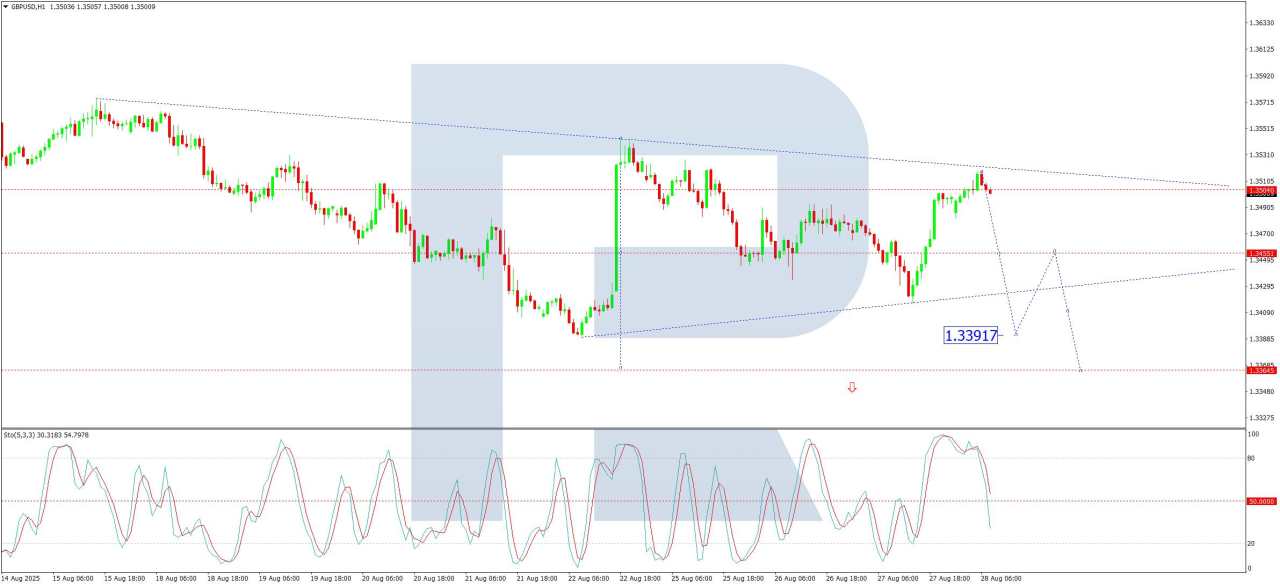
On the H1 chart, the market formed a downward wave structure towards 1.3417, which was followed by a corrective wave to 1.3517. The current expectation is for the initiation of a new declining wave towards 1.3455, with the potential to extend the downward structure towards the 1.3390 level. This scenario is technically corroborated by the Stochastic oscillator. Its signal line is currently below the 80 level and is trending sharply downwards towards 20, indicating strengthening bearish momentum.
Conclusion
The fundamental backdrop, characterised by persistent inflation and hawkish BoE rhetoric, offers near-term support for sterling. However, from a technical perspective, both the H4 and H1 charts suggest a high probability of a short-term bearish correction. Key levels to watch on the downside are 1.3360 and 1.3390. A break below these support levels could trigger a deeper pullback, despite the positive fundamental drivers.
Được in lại từ FXStreet, bản quyền được giữ lại bởi tác giả gốc.
Tuyên bố miễn trừ trách nhiệm: Quan điểm được trình bày hoàn toàn là của tác giả và không đại diện cho quan điểm chính thức của Followme. Followme không chịu trách nhiệm về tính chính xác, đầy đủ hoặc độ tin cậy của thông tin được cung cấp và không chịu trách nhiệm cho bất kỳ hành động nào được thực hiện dựa trên nội dung, trừ khi được nêu rõ bằng văn bản.


Tải thất bại ()