EUR/USD daily chart
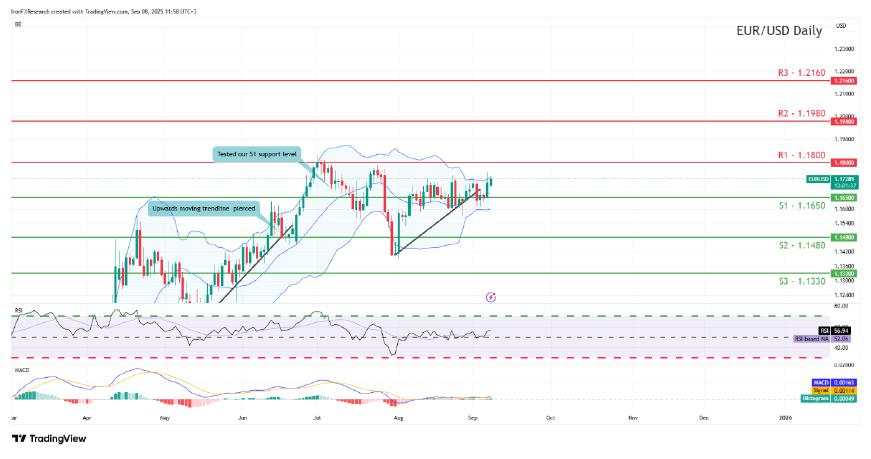
Support: 1.1650 (S1), 1.1480 (S2), 1.1330 (S3)
Resistance: 1.1800 (R1), 1.1980 (R2), 1.2160 (R3)
EUR/USD appears to be moving in an upwards fashion after resurfacing above our 1.1650 (S1) support level. We opt for a bullish outlook for the pair and supporting our case is the RSI indicator, which is currently near 60, which tends to imply a slight bullish market sentiment. For our bullish outlook to continue, we would require a clear break above our 1.1800 (R1) resistance level, with the next possible target for the bulls being the 1.1980 (R2) resistance line. On the other hand, for a sideways bias we would require the pair to remain confined between the 1.1650 (S1) support level and the 1.1800 (R1) resistance line. Lastly, for a bearish outlook we would require a clear break below our 1.1650 (S1) support line with the next possible target for the bears being the 1.1480 (S2) support level. On a monetary policy level, we would like to note that the ECB’s interest rate decision is set to occur this week and is certainly going to garner attention from EUR traders. The majority of market participants are currently anticipating the bank to remain on hold with EUR OIS currently implying a 99.1% probability for such a scenario to materialize. Hence, the EUR’s direction could be influenced by ECB President Lagarde’s press conference and possibly the bank’s accompanying statement, should it hint towards the bank’s next possible actions.
XAU/USD daily chart
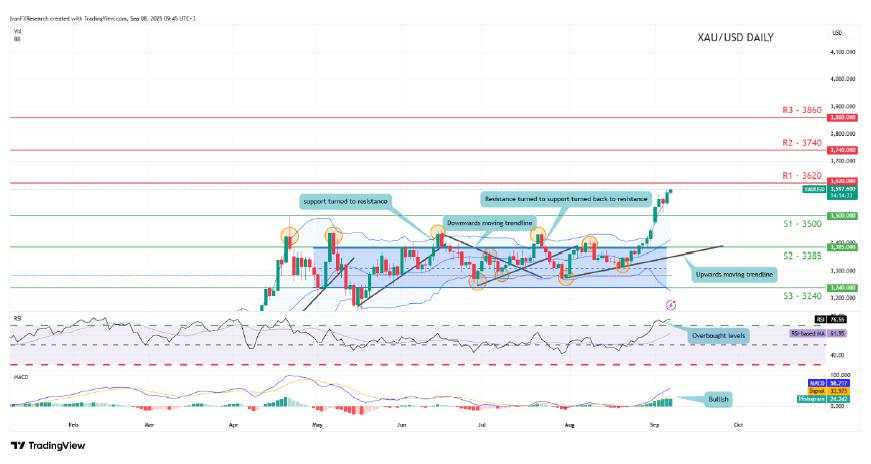
Support: 3500 (S1), 3385 (S2), 3240 (S3).
Resistance: 3620 (R1), 3740 (R2), 3860 (R3).
XAU/USD appears to be moving in an upwards fashion, with gold’s price currently taking aim for our hypothetical 3620 (R1) resistance level. We opt for a bullish outlook for gold’s price and supporting our case is the MACD indicator as well as the RSI indicator below our chart. In particular the RSI indicator currently registers a figure above 70 implying a strong bullish market sentiment. However, with the RSI’s figure being above 70 it may also imply that the commodity is overbought and due a correction to lower ground. Nonetheless, for our bullish outlook to continue we would require a break above our aforementioned 3620 (R1) resistance level, with the next possible target for the bulls also being the 3740 (R2) hypothetical resistance line. On the flip side for a sideways bias we would require the commodity’s price to remain confined between our 3500 (S1) support level and our 3620 (R1) resistance line. Lastly, for a bearish outlook we would require a clear break below our 3500 (S1) support line with the next possible target for the bears being the 3385 (S2) support level.
USD/JPY daily chart
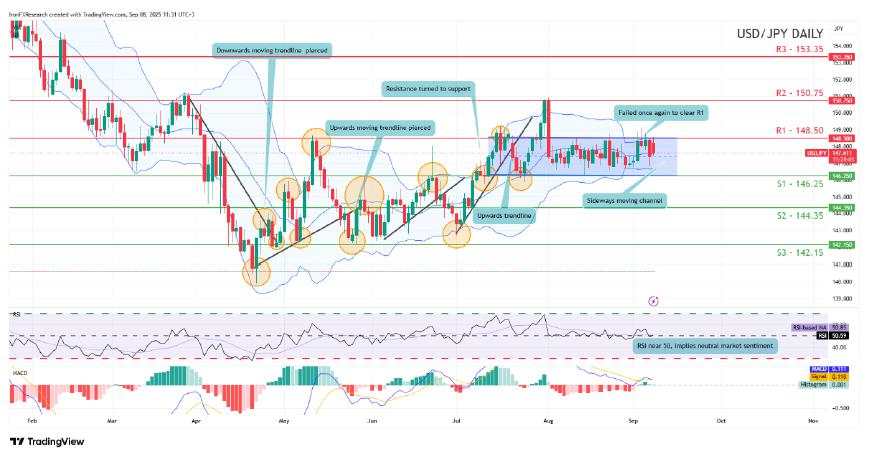
Support: 146.25 (S1), 144.35 (S2), 142.15 (S3).
Resistance: 148.50 (R1), 150.75 (R2), 153.35 (R3).
USD/JPY appears to be moving in a sideways fashion, after failing on numerous occasions to clear our 148.50 (R1) resistance line. Interestingly, Japan’s Prime Minister Ishida resigned yesterday and thus the political instability may have weighed on the JPY, although that does not appear to be the case as seen by our chart. We opt for a sideways bias for the pair, and supporting our case is the RSI indicator below our chart, which currently registers a figure near 50, implying a neutral market sentiment. For our sideways bias to be maintained, we would require the pair to remain confined between our 146.25 (S1) and our 148.50 (R1) resistance line. On the other hand, for a bearish outlook we would require a clear break below our 146.25 (S1) support level with the next possible target for the bears being the 144.35 (S2) support line. Lastly, for a bullish outlook we would a clear break above the 148.50 (R1) resistance level with the next possible target for the bulls being the 150.75 (R2) resistance line.
GBP/USD daily chart
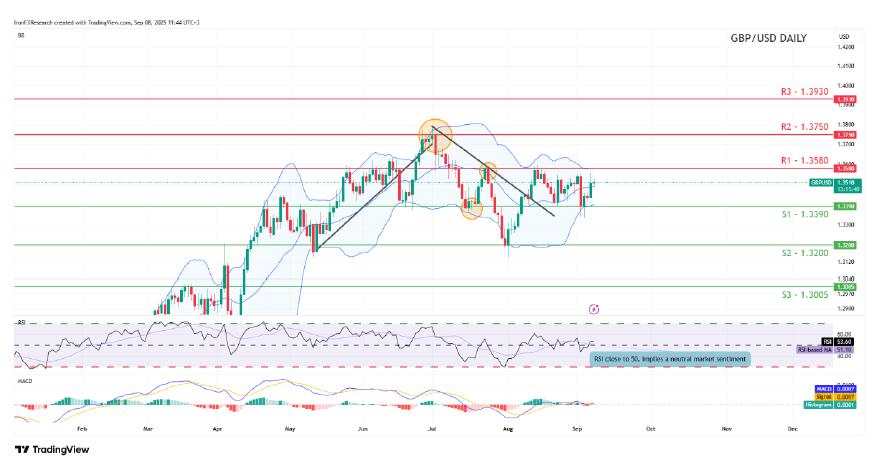
Support: 1.3390 (S1), 1.3200 (S2), 1.3005 (S3).
Resistance: 1.3580 (R1), 1.3750 (R2), 1.3930 (R3).
GBP/USD appears to be moving in a sideways fashion after failing to clear our 1.3390 (S1) support level. We opt for a sideways bias for the pair and supporting our case is the RSI indicator below our chart which currently registers a figure near 50, implying a neutral market sentiment. For our sideways bias to be maintained, we would require the pair to remain confined between our 1.3390 (S1) support level and our 1.3580 (R1) resistance line. On the other hand, for a bullish outlook, we would require a clear break above 1.3580 (R1) resistance level with the next possible target for the bulls being the 1.3750 (R2) resistance line. Lastly, for a bearish outlook we would require a break below our 1.3390 (S1) support level with the next possible target for the bears being the 1.3200 (S2) support line.
WTICash daily chart
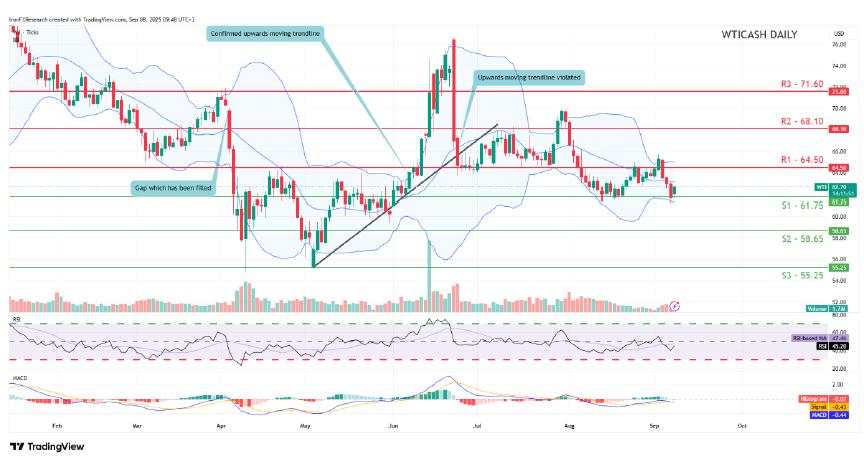
Support: 61.75 (S1), 58.65 (S2), 55.25 (S3).
Resistance: 64.50 (R1), 68.10 (R2), 71.60 (R3).
WTICash appears to be moving in a sideways fashion after failing to clear our 61.75 (S1) support level. On a fundamental note, we would like to point out that OPEC+ has agreed to increase their oil output in order to restore some of their diminishing market share. In turn this could lead to oil supply exceeding demand and thus may be seen as bearish for oil prices. Although, oil’s recent gains could be as market participants are pricing in that the aforementioned output increase is modest in nature.Nonetheless, we opt for a sideways bias for the commodity’s price as long as it remains confined between our 61.75 (S1) support level and our 64.50 (R1) resistance line. On the other hand, we would immediately switch our sideways bias in favour of a bearish outlook in the event of a break below our 61.75 (S1) support level with the next possible target for the bears being the 58.65 (S2) support line. Lastly, for a bullish outlook we would require a clear break above our 64.50 (R1) resistance line with the next possible target for the bulls being the 68.10 (R2) resistance level.
Được in lại từ FXStreet, bản quyền được giữ lại bởi tác giả gốc.
Tuyên bố miễn trừ trách nhiệm: Quan điểm được trình bày hoàn toàn là của tác giả và không đại diện cho quan điểm chính thức của Followme. Followme không chịu trách nhiệm về tính chính xác, đầy đủ hoặc độ tin cậy của thông tin được cung cấp và không chịu trách nhiệm cho bất kỳ hành động nào được thực hiện dựa trên nội dung, trừ khi được nêu rõ bằng văn bản.


Tải thất bại ()