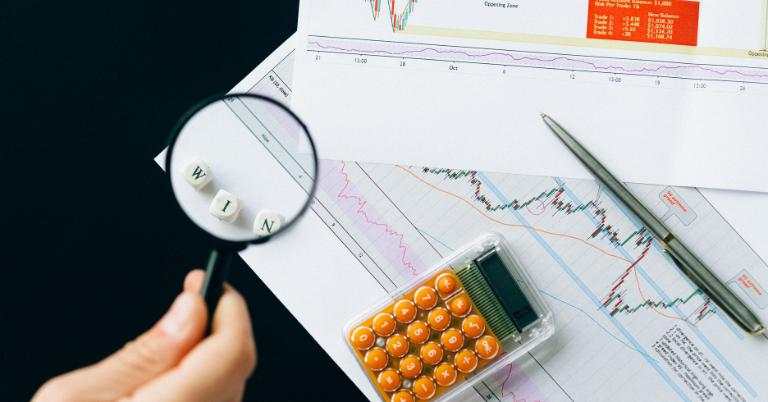
If most of your trades end in profit rather than loss, it’s easy to believe you’re a profitable trader. That belief initially makes sense, but trading performance runs deeper than simple profit and loss. To see the full picture, you need to track your performance, and that is where trading performance metrics come into play.
They are quantifiable indicators that show how well your strategy performs over time, tracking profitability, risk, and consistency. You can’t fully track these metrics without a trading journal. Metrics like win rate, drawdown, and profit factor reveal whether your system is consistent or chaotic and help you make informed decisions like a professional trader.
In this article, we will cover:
- The most important metrics to track your edge’s performance.
- How to calculate and interpret each metric.
- How to track your trading performance metrics to improve your edge.
Metrics
Metrics are essential to measuring your trading performance. Let’s dive in, starting with the most talked-about and often misunderstood metric:
Win Rate
Win rate is the percentage of trades that end in profit. It is an important metric because it shows how often your strategy wins compared to how often it loses. The formula is simple:
(Winning Trades ÷ Total Trades) × 100
If you take 10 trades and win 6, your win rate is 60%. Easy, but the catch is: a high win rate doesn’t always mean you’re making money. For example, if you win 70% of your trades but risk $100 to make $50, those frequent small wins can build confidence, yet one large loss can wipe them all out. The issue lies in your risk and reward, not your win rate, which leads to the next point.
Risk-to-Reward Ratio

The risk-to-reward ratio shows how much you risk compared to how much you aim to make. For example, risking $100 to make $300 gives you a 1:3 ratio. The higher the reward for every dollar you risk, the less often you need to win. With a 1:2 ratio, you can stay profitable even if you win only one-third of your trades. With a 1:3 ratio, you can win one out of four and still come out ahead.
Think of it this way: if your winning trades bring in more than your losing trades take away, you don’t need to win all the time. When you combine your win rate with your risk-to-reward ratio, you get a clearer view of your trading performance.
Expectancy
As Richard Dennis said in Trading in the Zone (2002): “You need at least 20 trades before you can really tell if your system works.” One or two wins mean nothing. What matters is how your results look over a decent sample size. Expectancy is different from win rate and risk-to-reward ratio because it combines both into one number that measures overall profitability. It measures the outcome of your entire strategy over time. If your expectancy is positive, your system works. If it’s negative, it doesn’t—no matter how high your win rate or risk-to-reward looks on paper.
The formula is:
(Win% × Average Win) – (Loss% × Average Loss)
Let’s make it simple. Let’s say you have a prop firm account and you take 10 trades, winning 6 of them. That means your trading system wins 60% of the time. Suppose your average win is $200 and your average loss is $100. Using the formula:
(0.60 × $200) – (0.40 × $100) = $120 – $40 = $80
On average, every trade you take earns you $80, showing that your strategy has a positive edge and could scale effectively with funded capital.
Note: To know your average win, add up the profit from all your winning trades and divide by the number of wins. Do the same to get your average losses.
Drawdown
Drawdown is like checking how bad things can get when your strategy hits a losing streak. It shows the biggest drop your account experiences before it starts growing again. For example, let’s say in your backtesting, your account went from $10,000 up to $12,000, then dropped to $9,000 at the worst point before rising again. That $3,000 drop (from $12,000 to $9,000) is your drawdown.
It tells you whether you can emotionally and financially handle that loss before giving up or breaking rules.
Consistency and Stability
This is another important performance metric. It shows how your edge behaves over time, through trending, ranging, or quiet markets. If your results change too much when the market shifts, that’s a sign to pay attention. Track it over a large sample of trades to see when your system performs well and when it weakens. Once you understand that pattern, you can adapt your trading style or risk to match the market you’re in.
How to Track Your Trading Performance Metrics
Knowing these key metrics means nothing if you don’t track them properly. Tracking turns data into insight, and insight into better decisions. Here’s how to track them effectively.
Track Your Trades Effectively
You can track your trading performance in two main ways: manually with your own records or automatically with a trading journal. If you prefer hands-on tracking, use Google Sheets, Keep, or even paper and pen. Manual tracking keeps you close to your data and helps you understand how your strategy behaves.
If you prefer automation, use a trading journal like Edgewonk or Tradezella. These tools can import your trades directly from your broker and calculate all key metrics for you—such as win rate, risk-to-reward ratio, profit factor, expectancy, and drawdowns. They also let you tag trades with notes on market conditions or emotions, helping you spot patterns behind your performance.
Whether automated or manual, the goal is the same: gather clear, consistent data so you can measure, review, and improve your trading edge using relevant performance metrics.
Review in Batches
Don’t judge your system after a few trades. Review results every 20–50 trades. Focus on what your expectancy is, how deep your drawdowns go, and which market type your system performs best in.
Watch Your Equity Curve
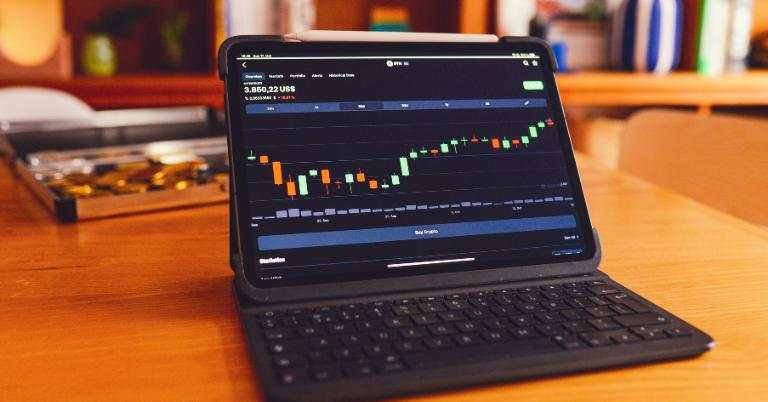
Your equity curve (account balance over time) gives a quick view of performance.
- A steady climb shows stability and consistency.
- Sharp dips highlight drawdowns or risky behavior.
Annotate your curve to see how market conditions align with performance changes. You can track your equity curve manually by recording your balance after each trade and noting when big wins or losses happen to spot patterns over time.
Combine Numbers with Notes
Metrics tell you what happened. Notes explain why. Write down how you felt, why you entered a trade, and what you saw in the market. Over time, you’ll see patterns like “I trade worse after losses” or “I perform best in trending markets.”
Conclusion
In trading, data beats guesswork. By focusing on meaningful metrics (win rate, R:R, profit factor, expectancy, drawdown, etc.), you gain a clear-eyed view of your strategy’s real performance and risk. Tracking these figures, ideally with a systematic journal, lets you tweak and improve your system based on evidence. Ultimately, the goal is a sustainable edge, not just occasional big wins.


Để lại tin nhắn của bạn ngay bây giờ