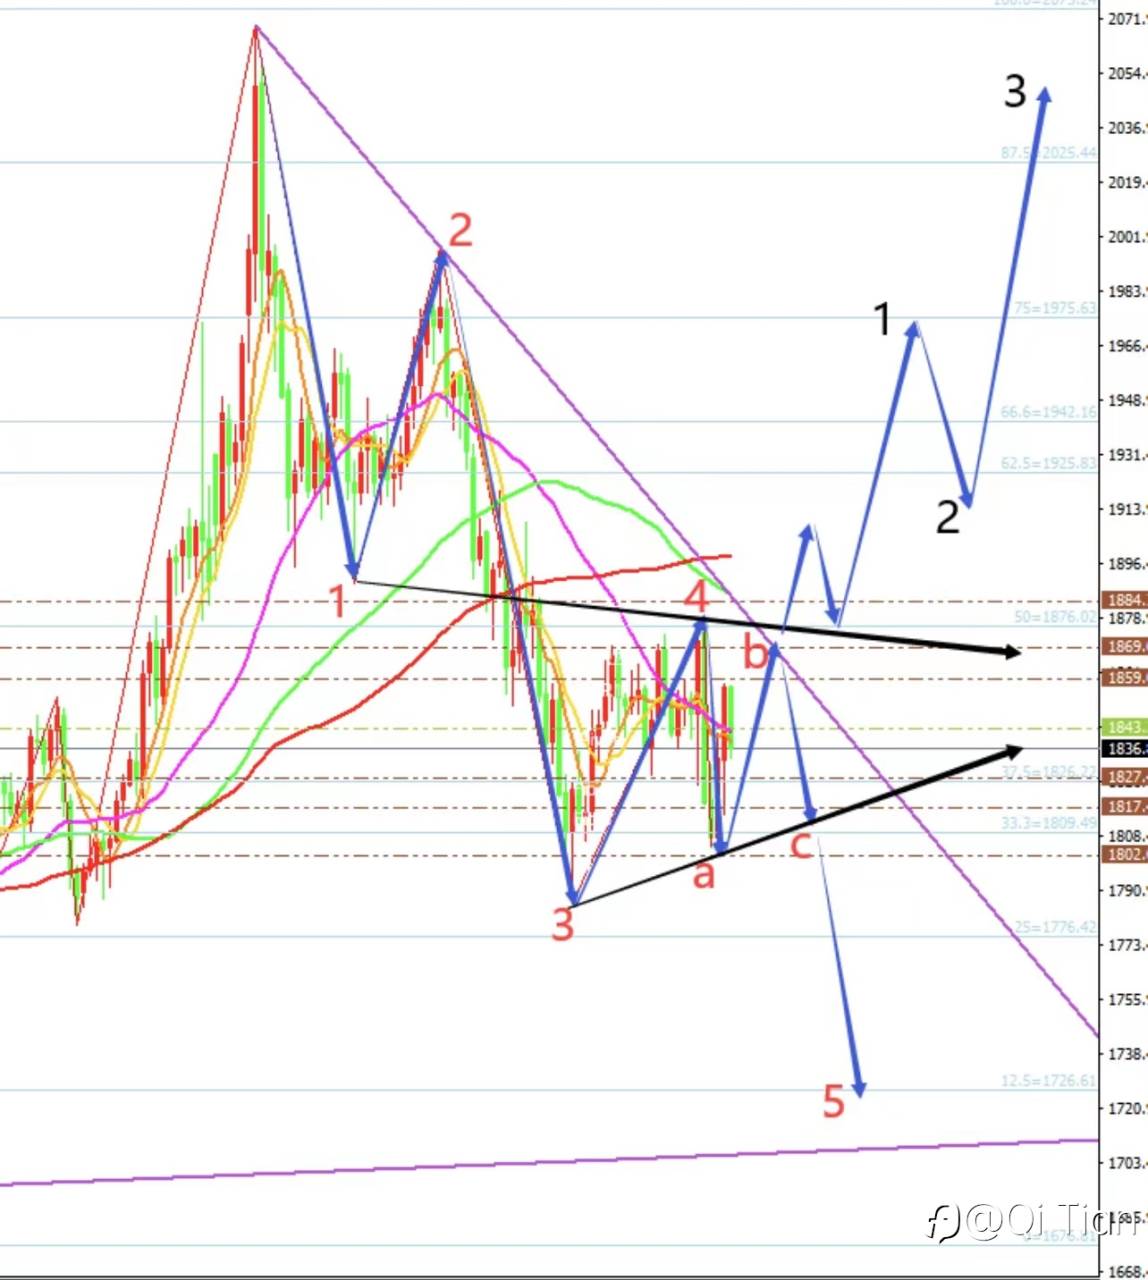
The price of gold showed a call back in pricing, ending with shocks around the 1842/1835 range, and the daily chart closed at positive chart. At present, the daily moving average system MA10/7 is flat, and the RSI indicator is still below the central axis. From the perspective of the daily line, the probability of continuing to fluctuate is high, and there is no clear direction and trend. The short-term four-hour chart and the hourly chart of the moving average re-condensed and glued together, and the RSI indicator returned to the central axis, making it clear that the price was in the upper line of the triangle finishing range to see 1845/48 for suppression, and the lower line of the triangle to see 1828/1825 for support.
Today’s trading protocol is to sell at high and buy at low, but still see wide fluctuations. The upper resistance is 1848/1856/1868/1878, and the lower support is 1832/1828/1820/1808.

Tuyên bố miễn trừ trách nhiệm: Quan điểm được trình bày hoàn toàn là của tác giả và không đại diện cho quan điểm chính thức của Followme. Followme không chịu trách nhiệm về tính chính xác, đầy đủ hoặc độ tin cậy của thông tin được cung cấp và không chịu trách nhiệm cho bất kỳ hành động nào được thực hiện dựa trên nội dung, trừ khi được nêu rõ bằng văn bản.

-KẾT THÚC-