#usoil
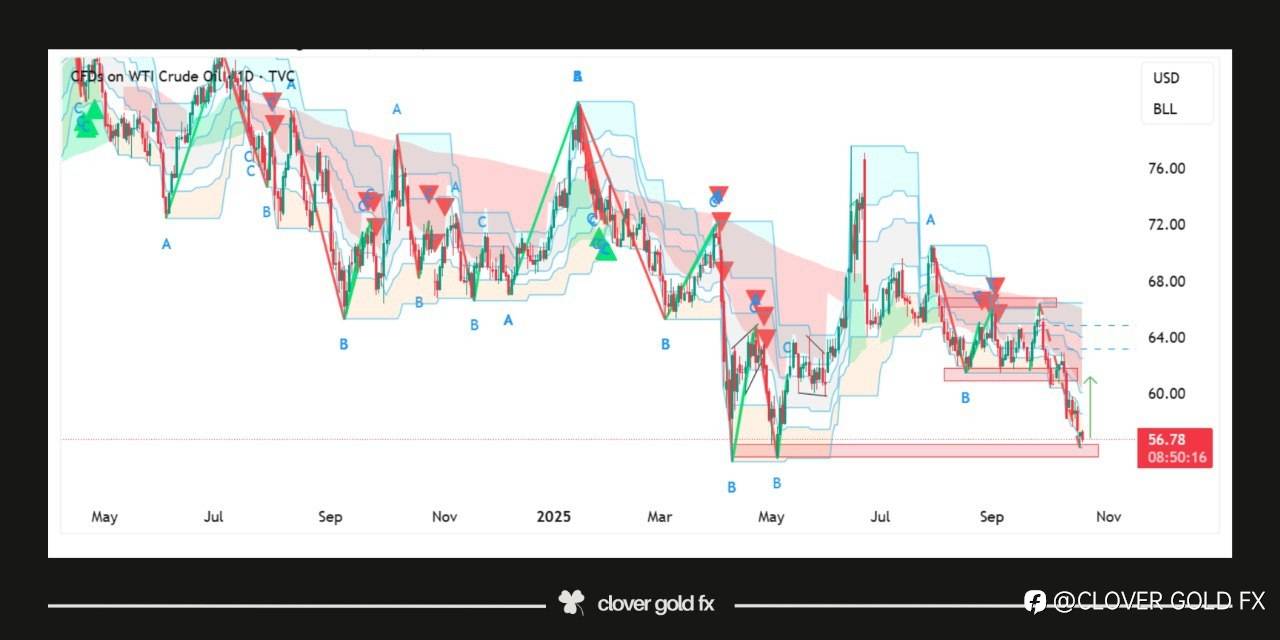
The daily chart of US Oil shows a clear technical structure indicating potential bullish momentum ahead. After an extended downtrend the market has formed a triple bottom pattern which often signals exhaustion of selling pressure and a possible reversal. The appearance of a bullish hammer at this key support zone further strengthens the idea that buyers are stepping in to defend the area. Following the earlier range breakout and rejection from horizontal resistance the price has now returned to a major demand region where previous reactions have occurred. This combination of patterns suggests that the market could soon experience upward movement as sentiment shifts from bearish to bullish with traders watching closely for confirmation of continued strength in the coming sessions.
Tuyên bố miễn trừ trách nhiệm: Quan điểm được trình bày hoàn toàn là của tác giả và không đại diện cho quan điểm chính thức của Followme. Followme không chịu trách nhiệm về tính chính xác, đầy đủ hoặc độ tin cậy của thông tin được cung cấp và không chịu trách nhiệm cho bất kỳ hành động nào được thực hiện dựa trên nội dung, trừ khi được nêu rõ bằng văn bản.


Tải thất bại ()