#xauusd #xᴀᴜᴜsᴅ
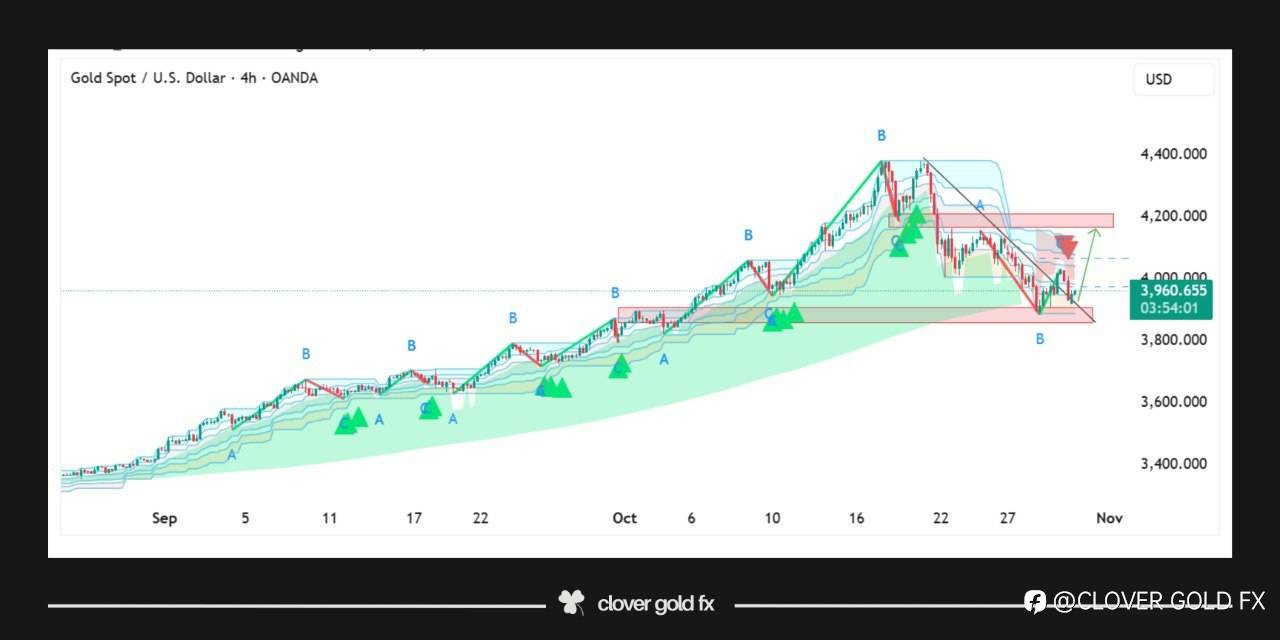
Gold on the 4H chart shows that the market completed a five wave bullish structure and after reaching the top it started a corrective phase that moved down in three clear waves labeled a b and c the price is reacting around the horizontal support zone where buyers are trying to regain control the descending trend line marks the limit of the corrective phase and a breakout above it may indicate the start of a fresh upward movement the pattern suggests that gold might build strength around this area before targeting higher levels again showing a possible shift from correction to continuation of the overall bullish trend
Tuyên bố miễn trừ trách nhiệm: Quan điểm được trình bày hoàn toàn là của tác giả và không đại diện cho quan điểm chính thức của Followme. Followme không chịu trách nhiệm về tính chính xác, đầy đủ hoặc độ tin cậy của thông tin được cung cấp và không chịu trách nhiệm cho bất kỳ hành động nào được thực hiện dựa trên nội dung, trừ khi được nêu rõ bằng văn bản.

Để lại tin nhắn của bạn ngay bây giờ