#cadchf #cad #chf
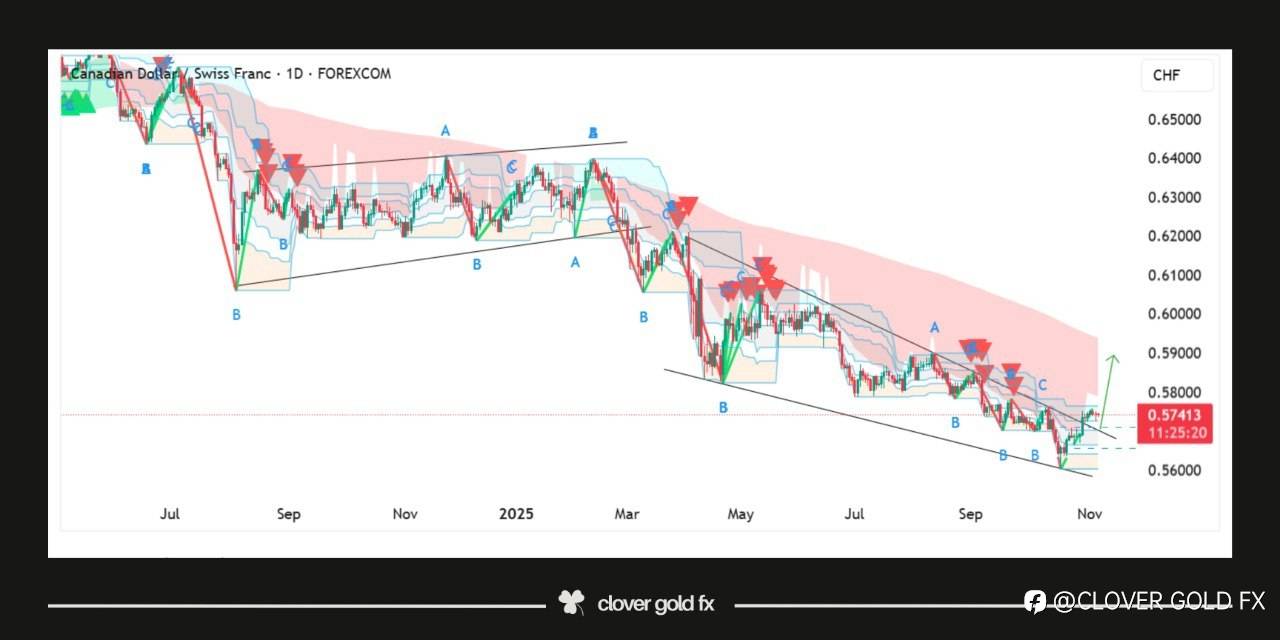
The CADCHF 14H chart shows that the pair has been trading in a clear downtrend forming a falling wedge pattern after an extended bearish move. The recent solid breakout from the wedge signals a potential shift in momentum as buyers start gaining strength. The breakout candle indicates increased bullish activity suggesting that the market may attempt a corrective rally toward the next resistance area shown by the red arrow. This upward move represents a possible reversal phase where price could retest previous structure levels before deciding its next major direction. Overall the chart reflects early signs of recovery with the breakout acting as a key confirmation for short term bullish continuation.
Tuyên bố miễn trừ trách nhiệm: Quan điểm được trình bày hoàn toàn là của tác giả và không đại diện cho quan điểm chính thức của Followme. Followme không chịu trách nhiệm về tính chính xác, đầy đủ hoặc độ tin cậy của thông tin được cung cấp và không chịu trách nhiệm cho bất kỳ hành động nào được thực hiện dựa trên nội dung, trừ khi được nêu rõ bằng văn bản.

Để lại tin nhắn của bạn ngay bây giờ