EQT Corporation (NYSE: EQT) found a strong buying opportunity in the 2023 Blue Box Area, allowing the stock to resume its rally toward new all-time highs. Moreover, in today's article, we explore the Elliott Wave structure, highlighting potential paths and targets for its continued bullish momentum.
EQT Weekly Chart
Elliott Wave Analysis
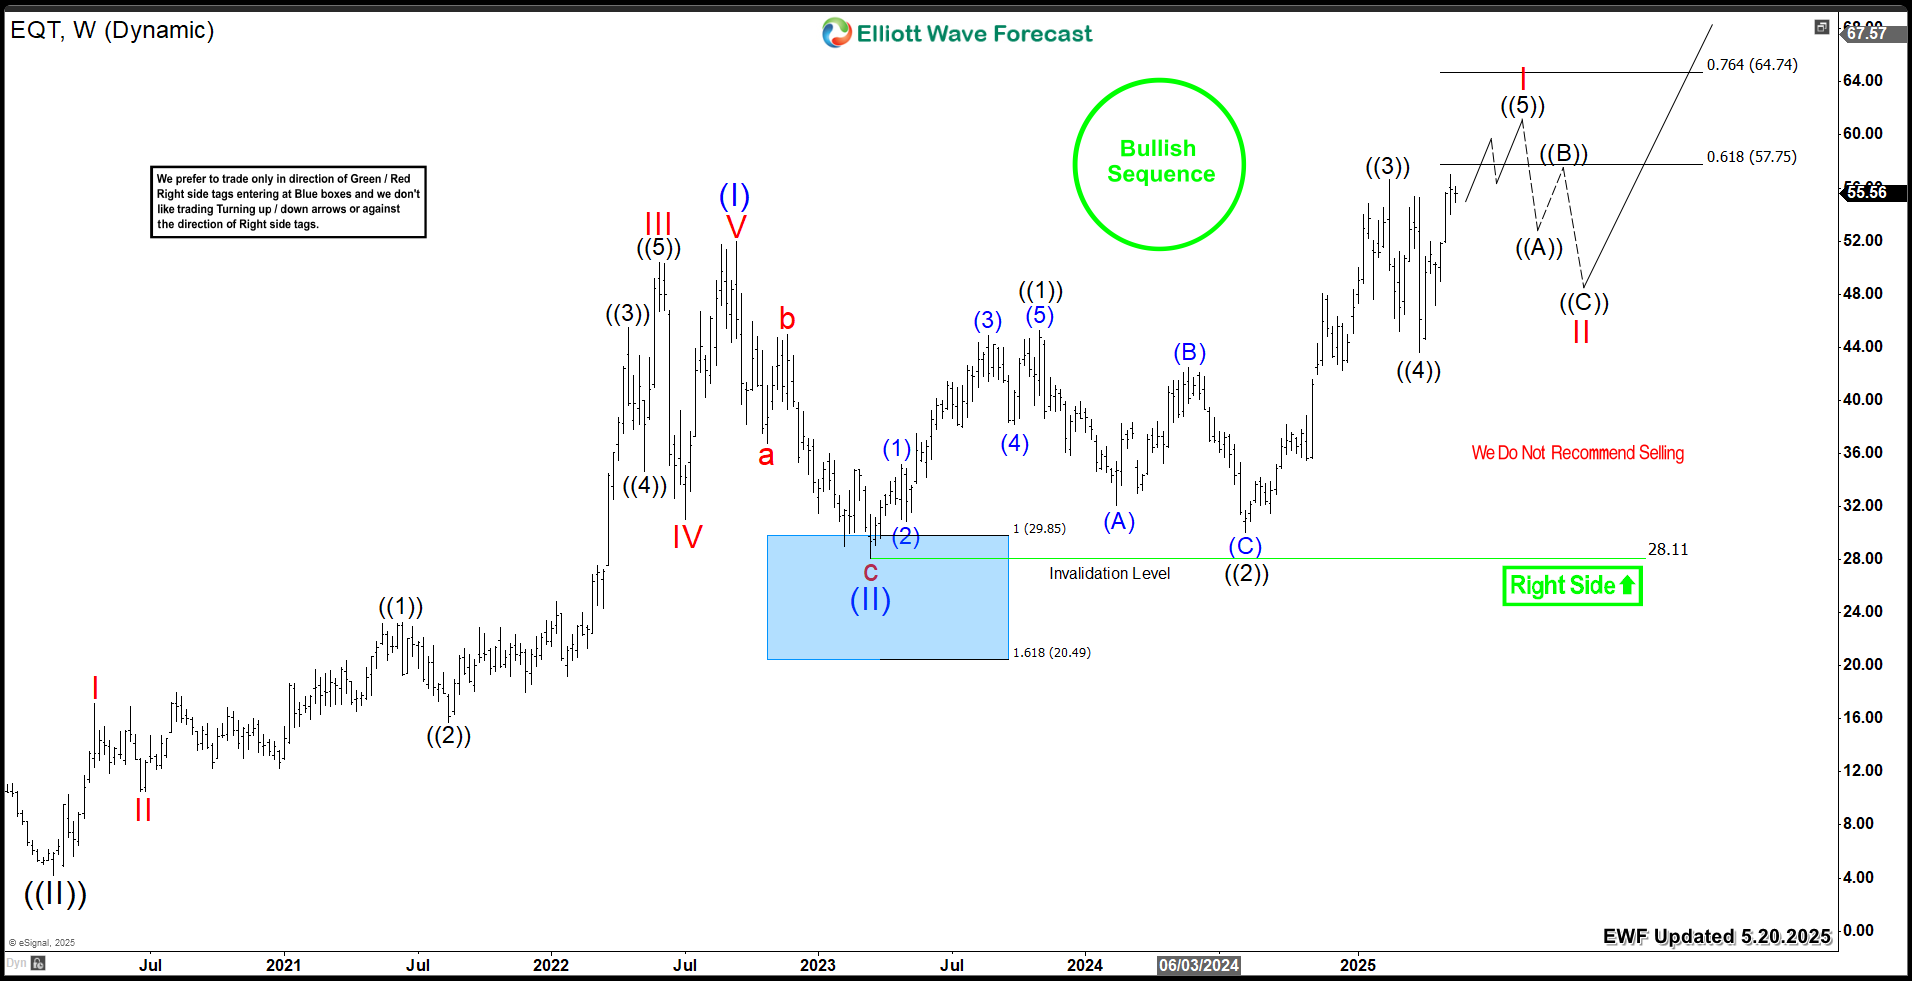
The weekly chart of EQT highlights its advance from the 2020 low, with wave (I) peaking at $51.97, followed by a 3-wave pullback in wave (II) that ended at $28.11. After that, the stock confirmed a bullish sequence by reaching new all-time highs, signaling the continuation of wave (III).
Currently, EQT is progressing through a 5-wave advance from its 2023 low, steadily approaching the 61.8% Fibonacci extension zone at $57.75 - $64.74, where wave I of (III) could complete. Moreover, once this level is reached, a wave II pullback is expected, providing a buying opportunity in 3, 7, or 11 swings. Furthermore, the stock remains supported, with the next upside target aiming for the equal legs area between $76 - $105.
Conclusion
The bullish Grand Super Cycle for EQT continues, creating opportunities to buy daily and weekly corrective pullbacks using our Elliott Wave strategy. The best approach involves entering after the stock completes a 3, 7, or 11 swing sequence from its peak. Moreover, our extreme Blue Box system improves precision, helping traders identify entry points with clarity and confidence.
Tuyên bố miễn trừ trách nhiệm: Nội dung trên chỉ đại diện cho quan điểm của tác giả hoặc khách mời. Nó không đại diện cho quan điểm hoặc lập trường của FOLLOWME và không có nghĩa là FOLLOWME đồng ý với tuyên bố hoặc mô tả của họ, cũng không cấu thành bất kỳ lời khuyên đầu tư nào. Đối với tất cả các hành động do khách truy cập thực hiện dựa trên thông tin do cộng đồng FOLLOWME cung cấp, cộng đồng không chịu bất kỳ hình thức trách nhiệm nào trừ khi có cam kết rõ ràng bằng văn bản.
Website Cộng đồng Giao Dịch FOLLOWME: www.followme.asia


Tải thất bại ()