Đăng ký
Đăng nhập
Quên mật khẩu
Phổ biến
Khám phá tín hiệu giao dịch
Cuộc thi
Giải thưởng nhà môi giới
Ngôi sao
Thị trường
Người tạo
Chính sách quyền riêng tư
Điều khoản dịch vụ
Trung tâm Trợ giúp
Liên hệ chúng tôi
Trang Thương hiệu
Tuyên bố miễn trừ trách nhiệm
Xem thêm...
© 2026 Followme
elliottwaveforecast
364 Người theo dõi
·
1 Đang theo dõi
Từ
28 Feb 2023
Theo dõi
Bài đăng
Giới thiệu
elliottwaveforecast
4d
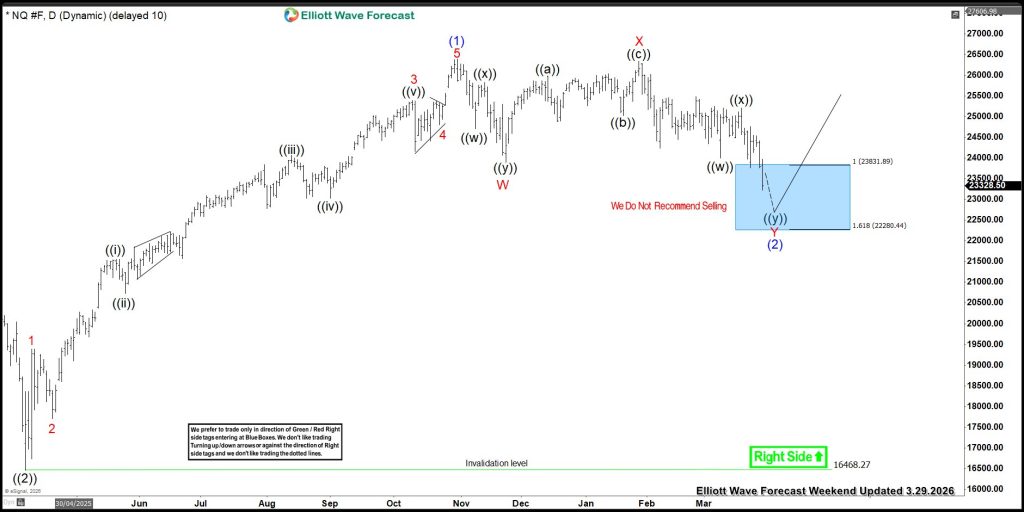
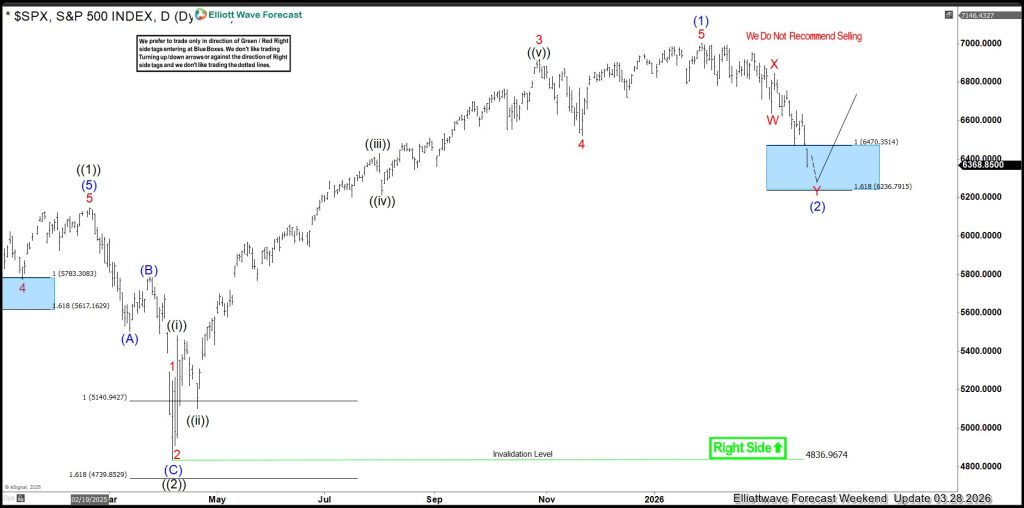
Market Respects the Blue Box in SPX(S&P500), Delivering the Anticipated Move Amid War
In trading, there are moments that validate not just a strategy—but an entire framework of understanding market behavior. The recent movement in the S&P 500 is one of those moments. Weeks ago, we outlined a projection that the market would decline into a predefined Blue Box area 6470.3514 – 6236
elliottwaveforecast
4d
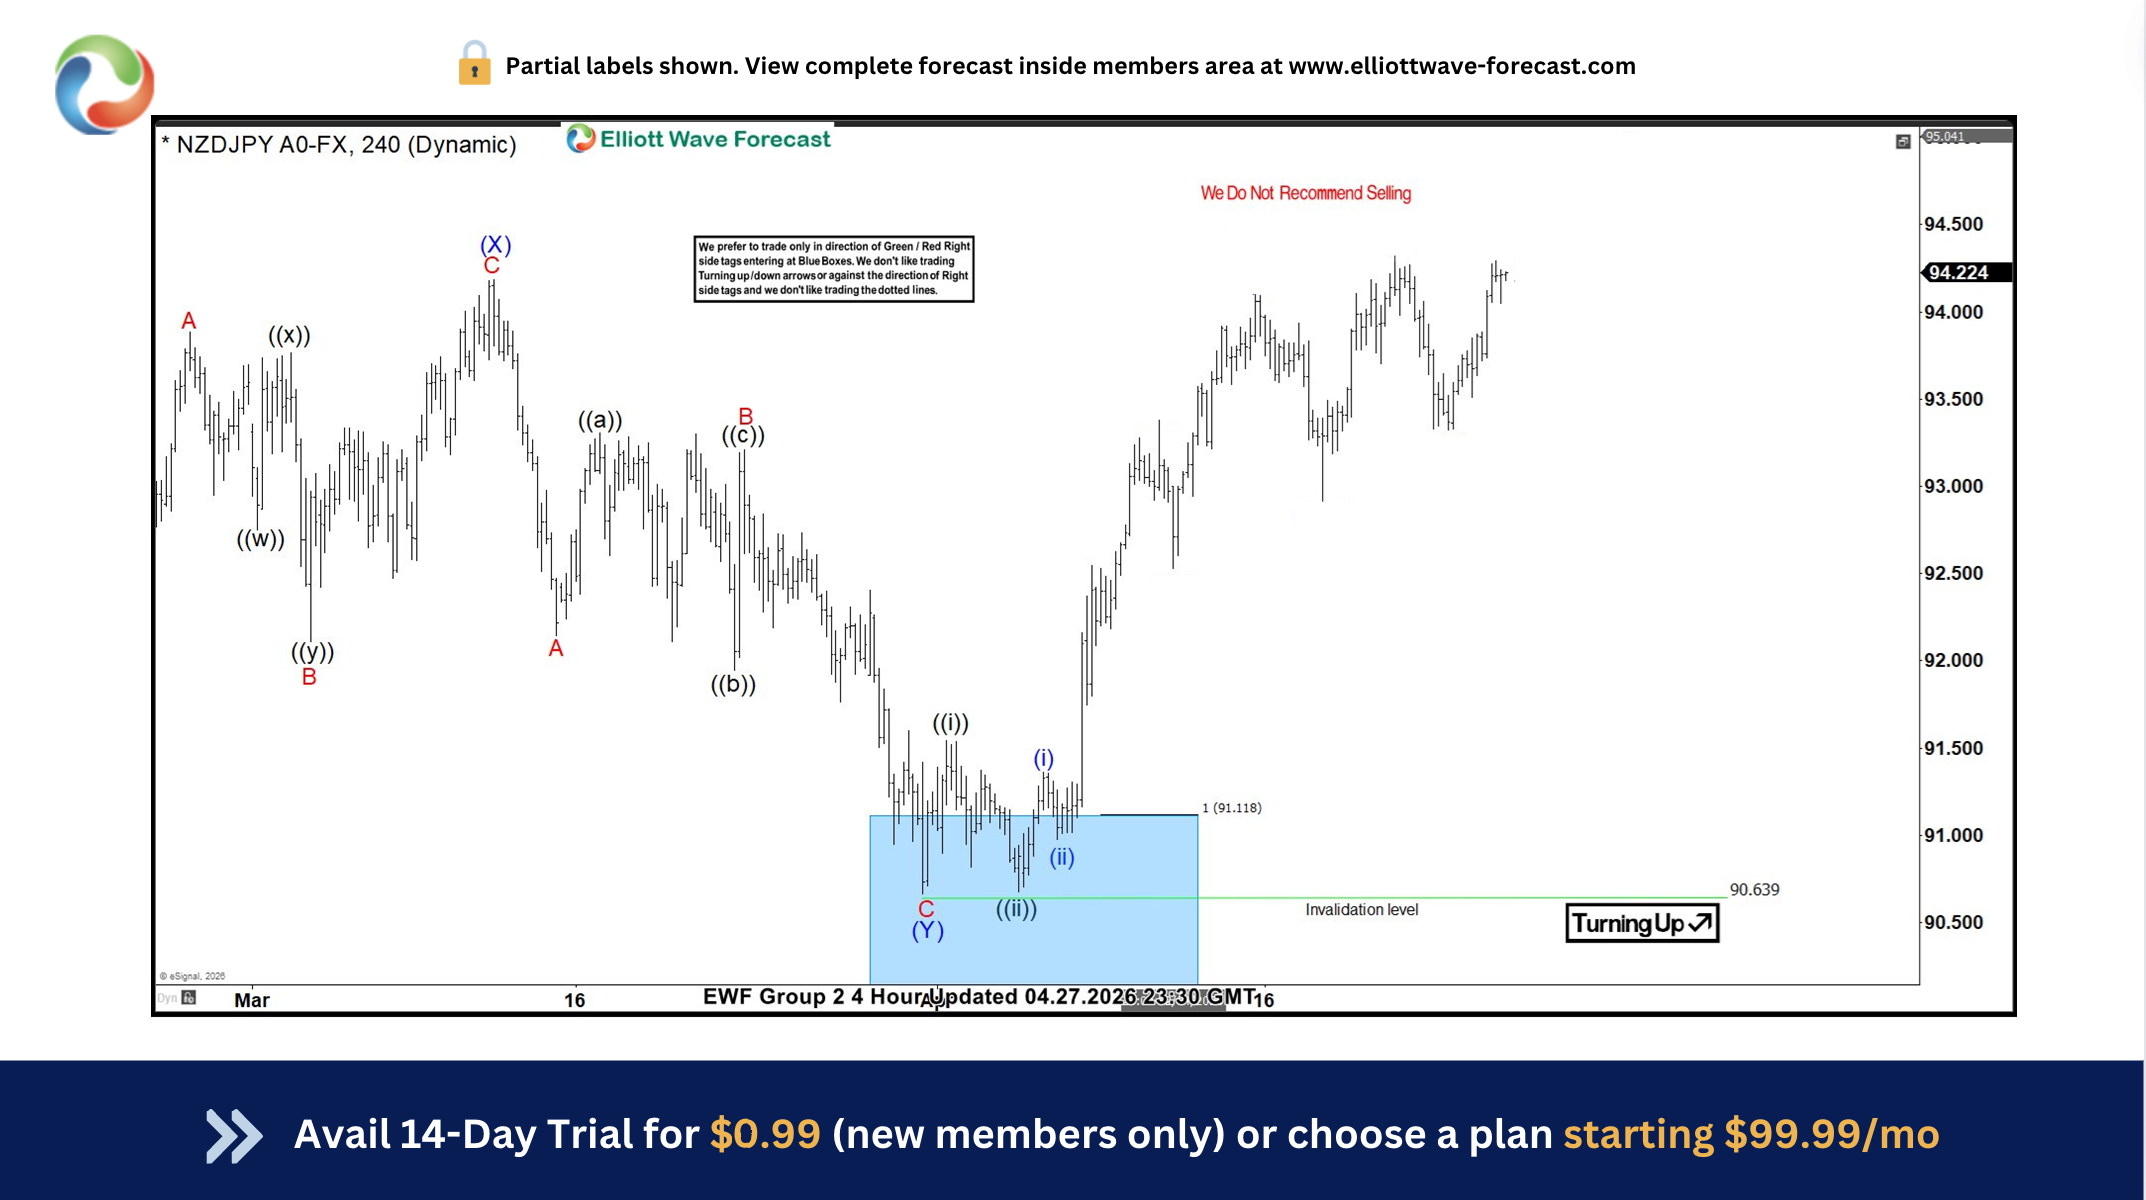
Elliott Wave in Action: NZDJPY Pushes Higher from Blue Box Area
In this technical blog, we will look at the past performance of the 4-hour Elliott Wave Charts of NZDJPY. In which, the rally from 09 April 2025 low is unfolding as an impulse sequence. Therefore, called for more upside to take place. We knew that the structure in the pair should remains incomplete
elliottwaveforecast
4d
Citigroup (NYSE: C) Bullish Path Above $150
Citigroup (NYSE: C) resumed its bullish trend despite an early correction this year. The stock broke again to new all-time highs. Today, we dive into its daily technical chart. Our analysis explores the Elliott Wave structure currently supporting the rally. Looking at Citigroup's daily chart, the cy
elliottwaveforecast
4d
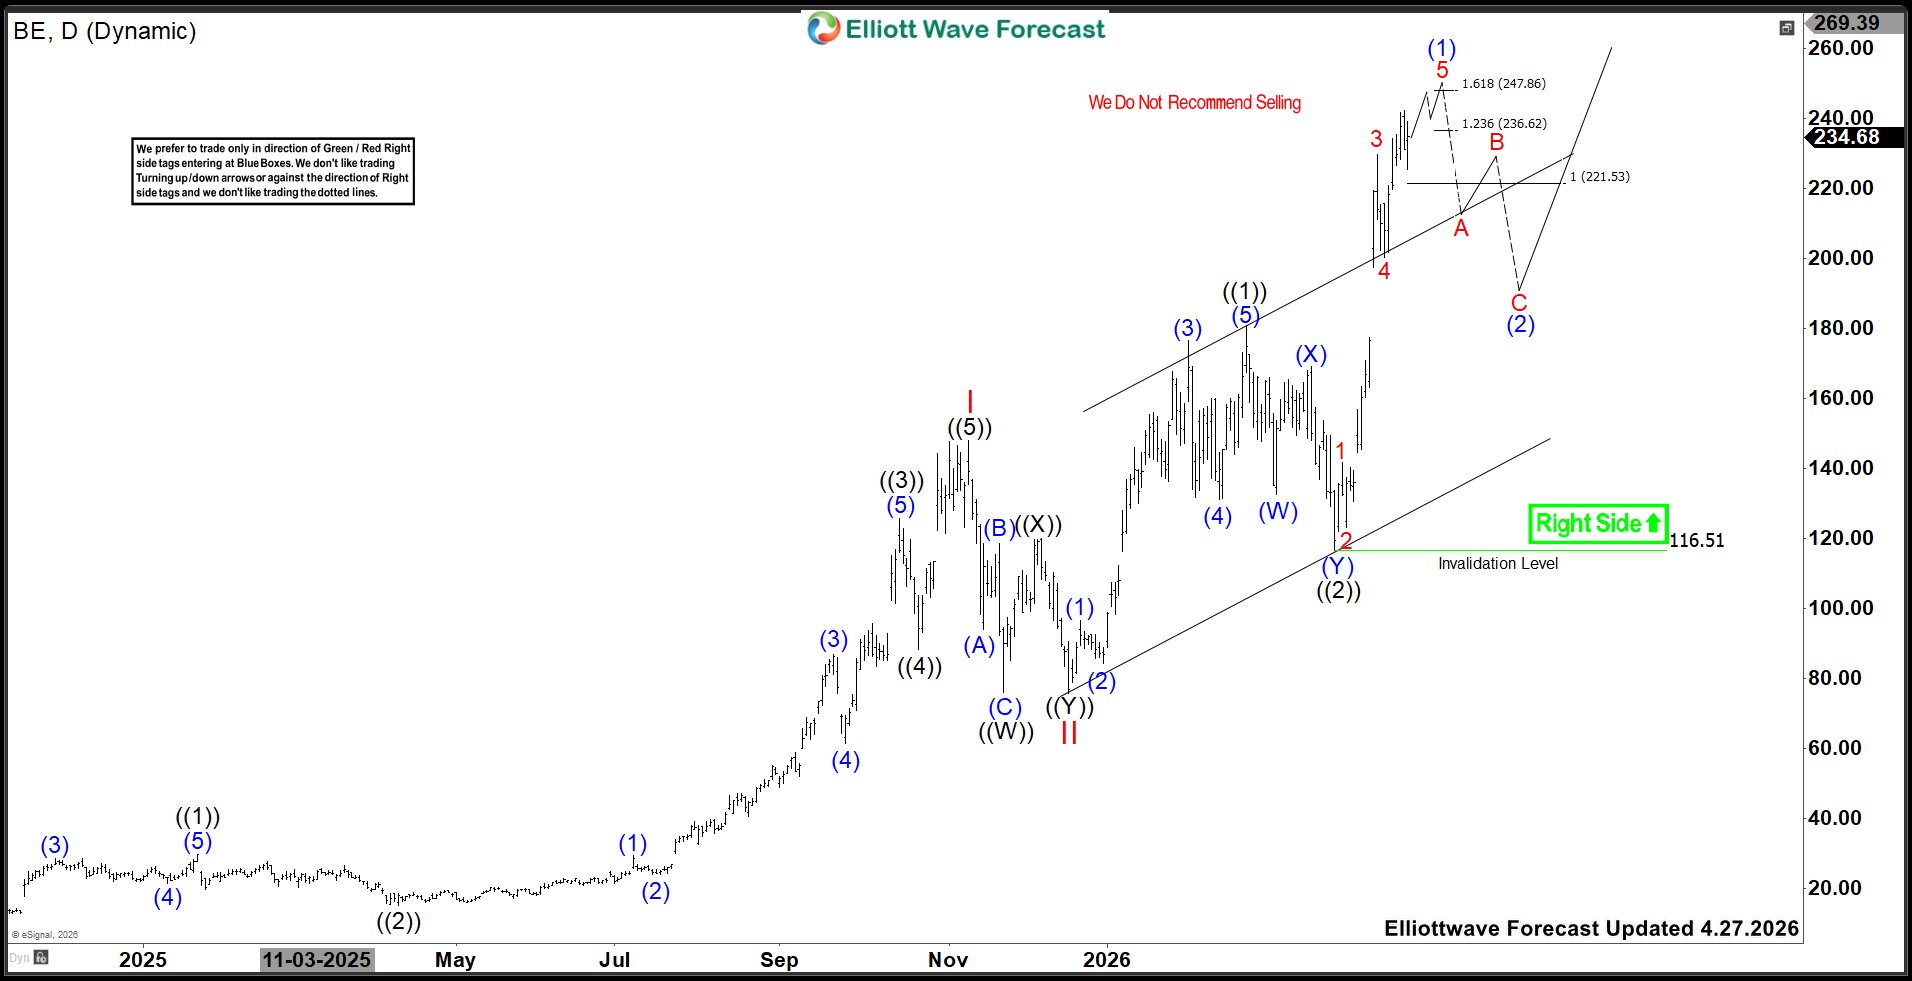
Bloom Energy (BE): Favors Rally in to $247.8–$286.5 Zone Before Pullback
Bloom Energy Corporation., (BE) designs, manufactures, sells & install solid-oxide fuel cell systems for on-site power generation in the United States & globally. It offers Bloom Energy Server, a power generation platform to convert different fuels through electrochemical process. It comes u
elliottwaveforecast
4d
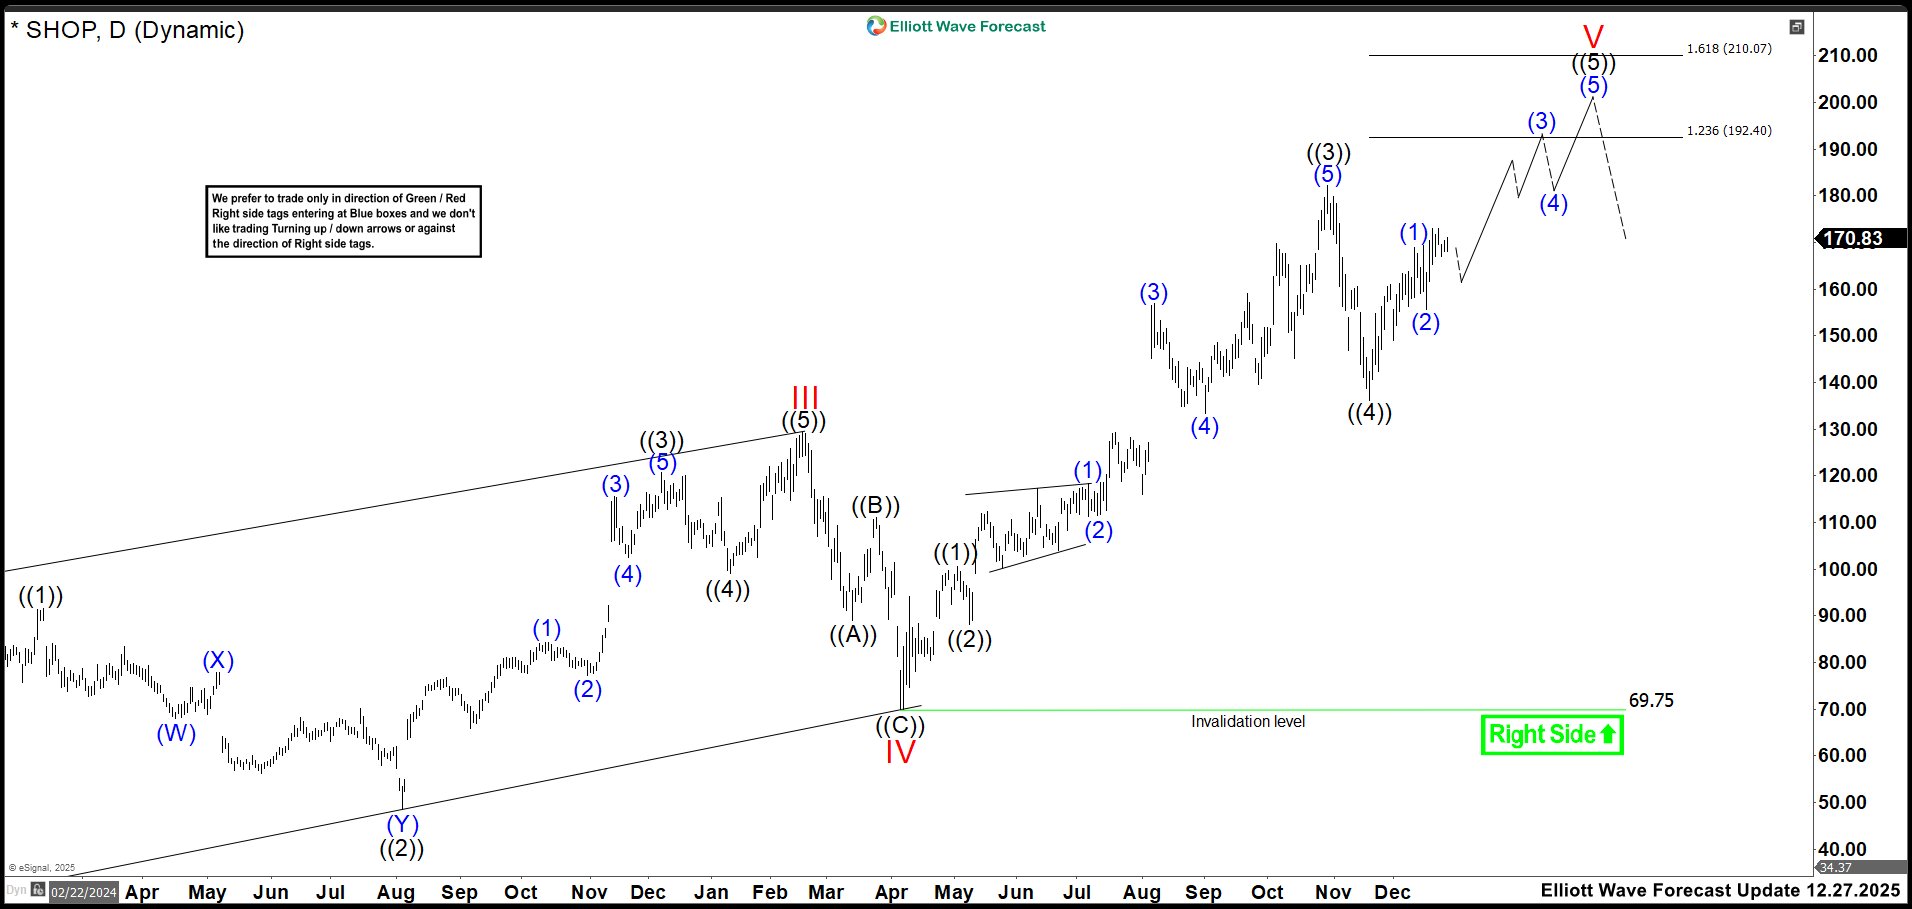
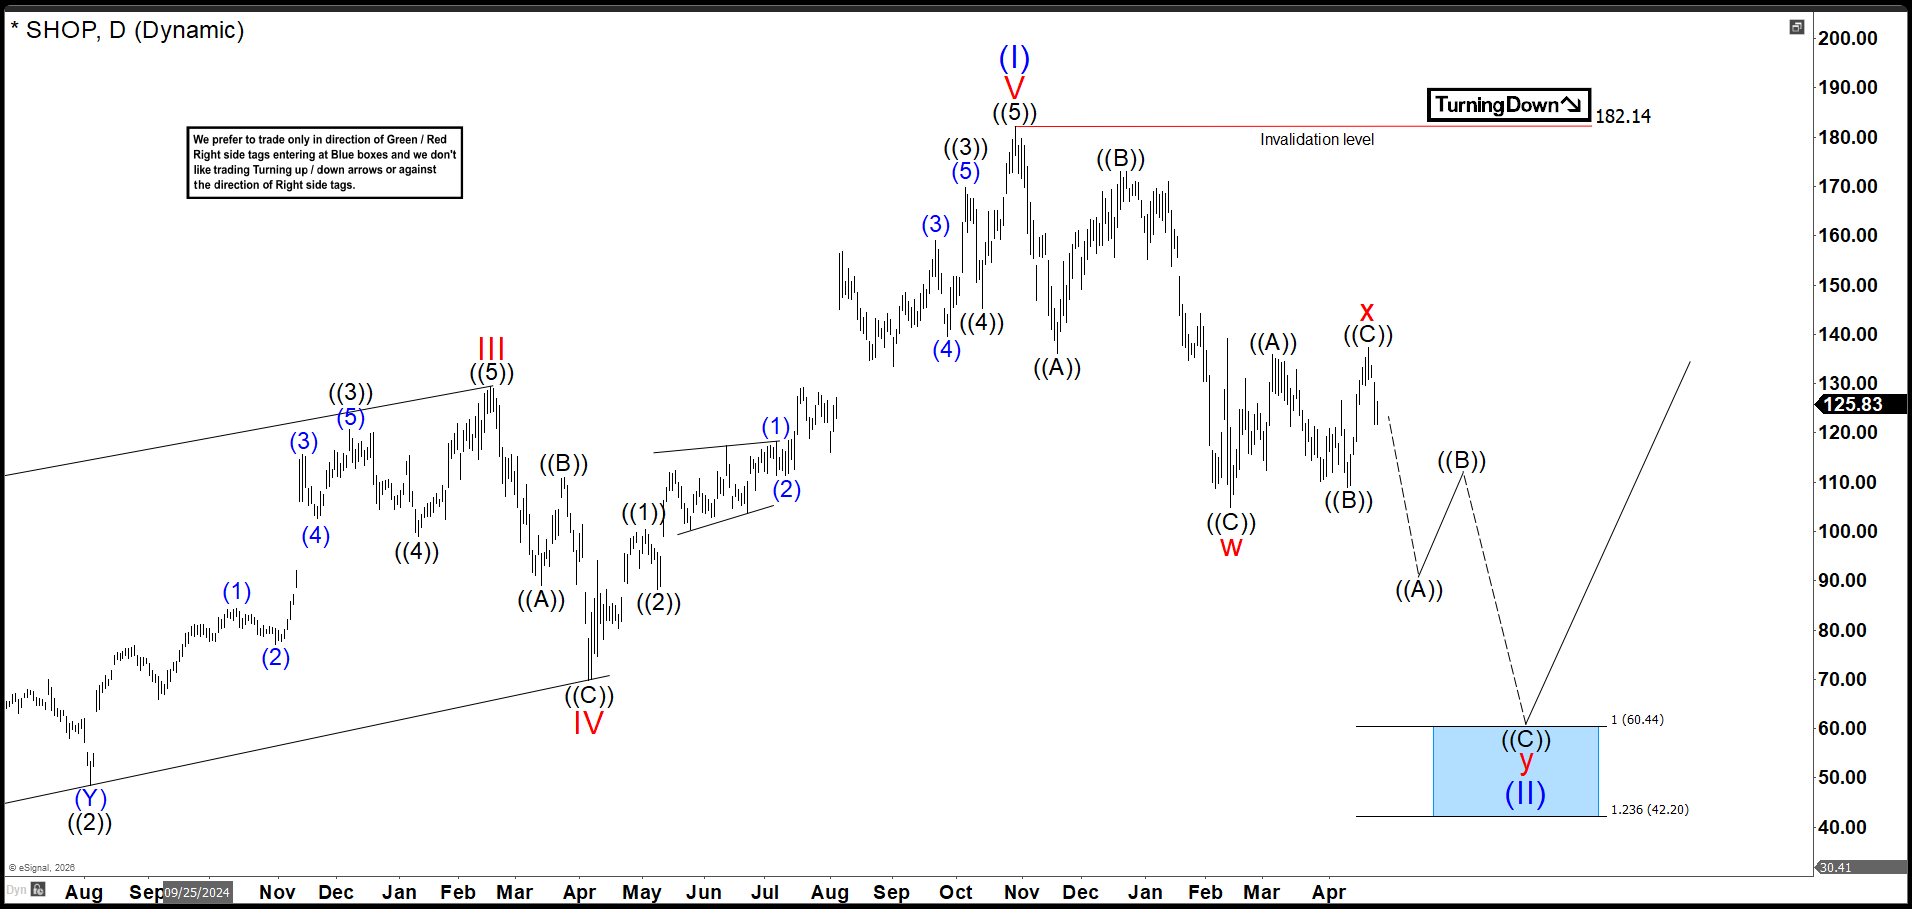
SHOP Breakdown: Wave (II) Scenario Gains Strength After Weak Rebound
Shopify's (SHOP) stock has been experiencing a bit of a downturn recently, and investors are eager to see what the second and third quarters of the year will hold. Analysts expect that the company will focus on refining its e-commerce tools and expanding its merchant solutions. Consequently, there’s
elliottwaveforecast
5d
$HG_F (Copper) DR Copper Is Calling Risk On
The whole market is on edge. Over the past year, we have seen tariffs, geopolitical conflict, and oil prices skyrocket. All of this has created a high level of uncertainty and fear across global markets. At ElliottWave-Forecast, we do not focus heavily on fundamentals or news-driven events. Instead,
+1
elliottwaveforecast
5d
USDCHF Plunges Beneath The Blue Box - Sellers In profit
Hello traders and welcome to a new blue box article where we discuss recent trade setups. In this one, the spotlight will be on USDCHF. USDCHF has been a traditionally bearish market since the turn of the millennium. It has exhibited a series of lower lows and larger highs within larger bearis
elliottwaveforecast
5d
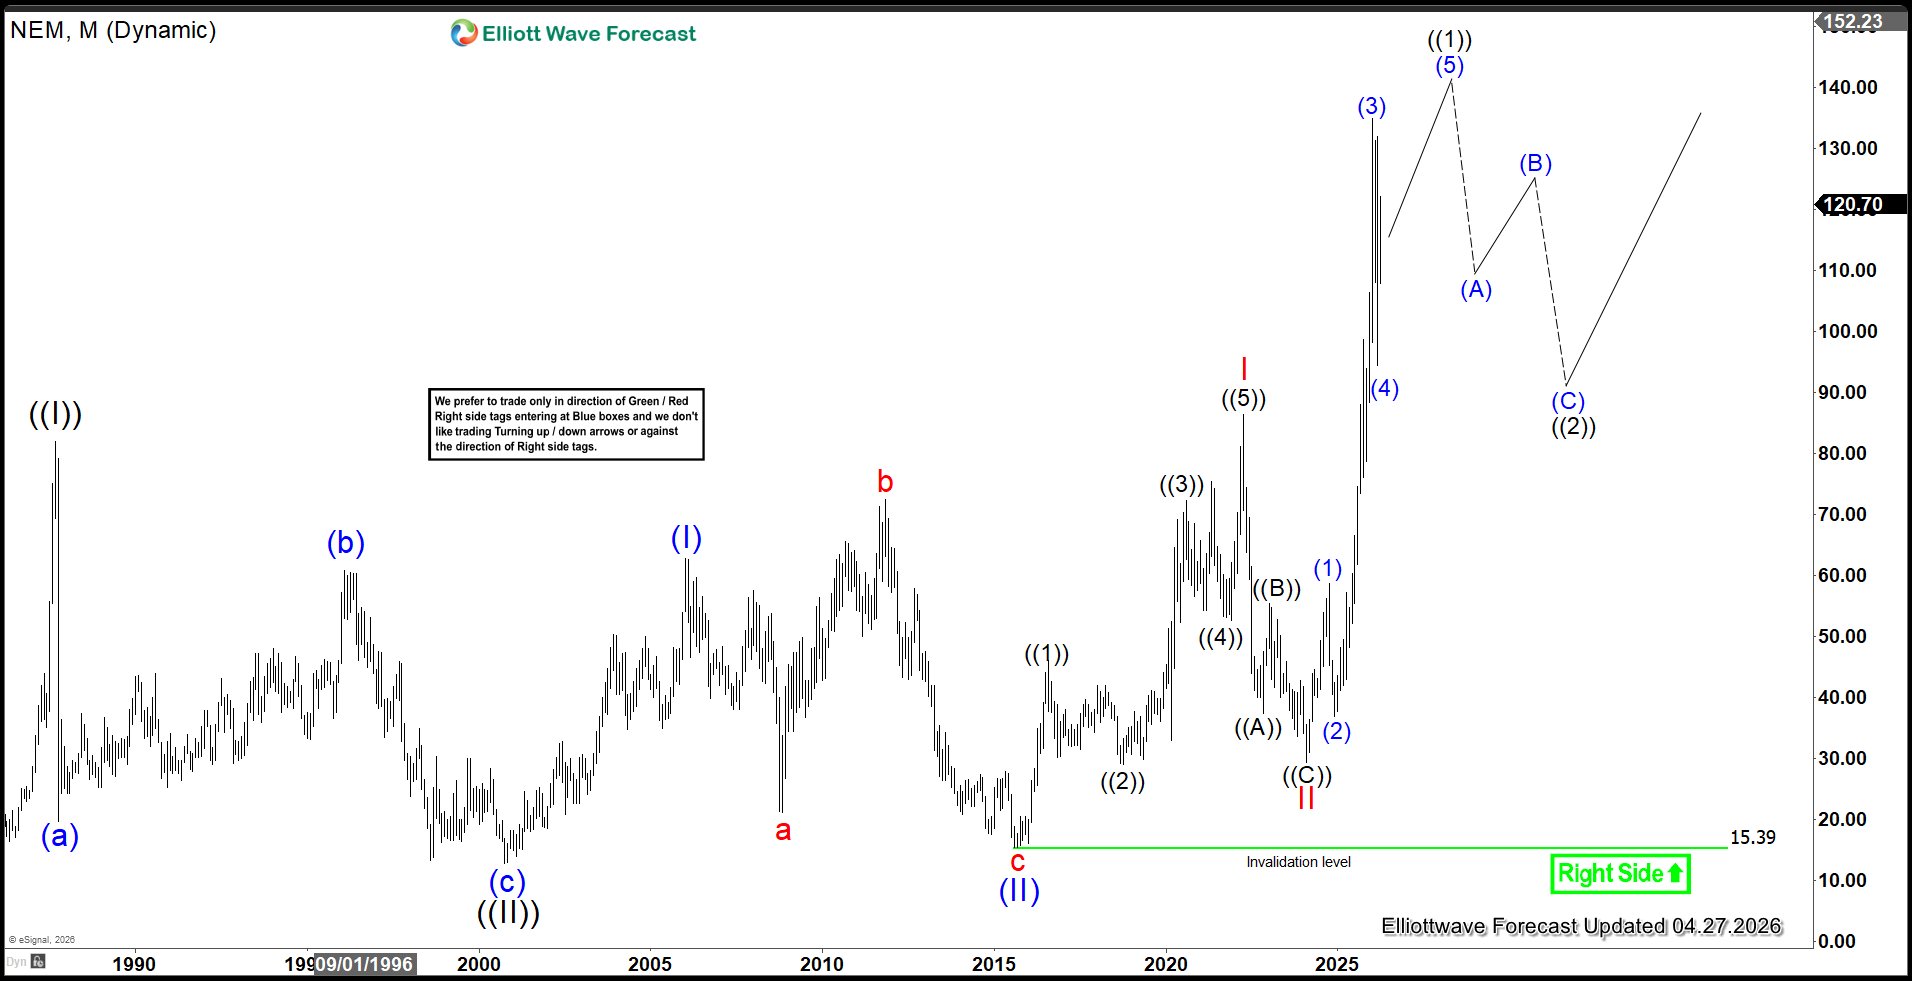
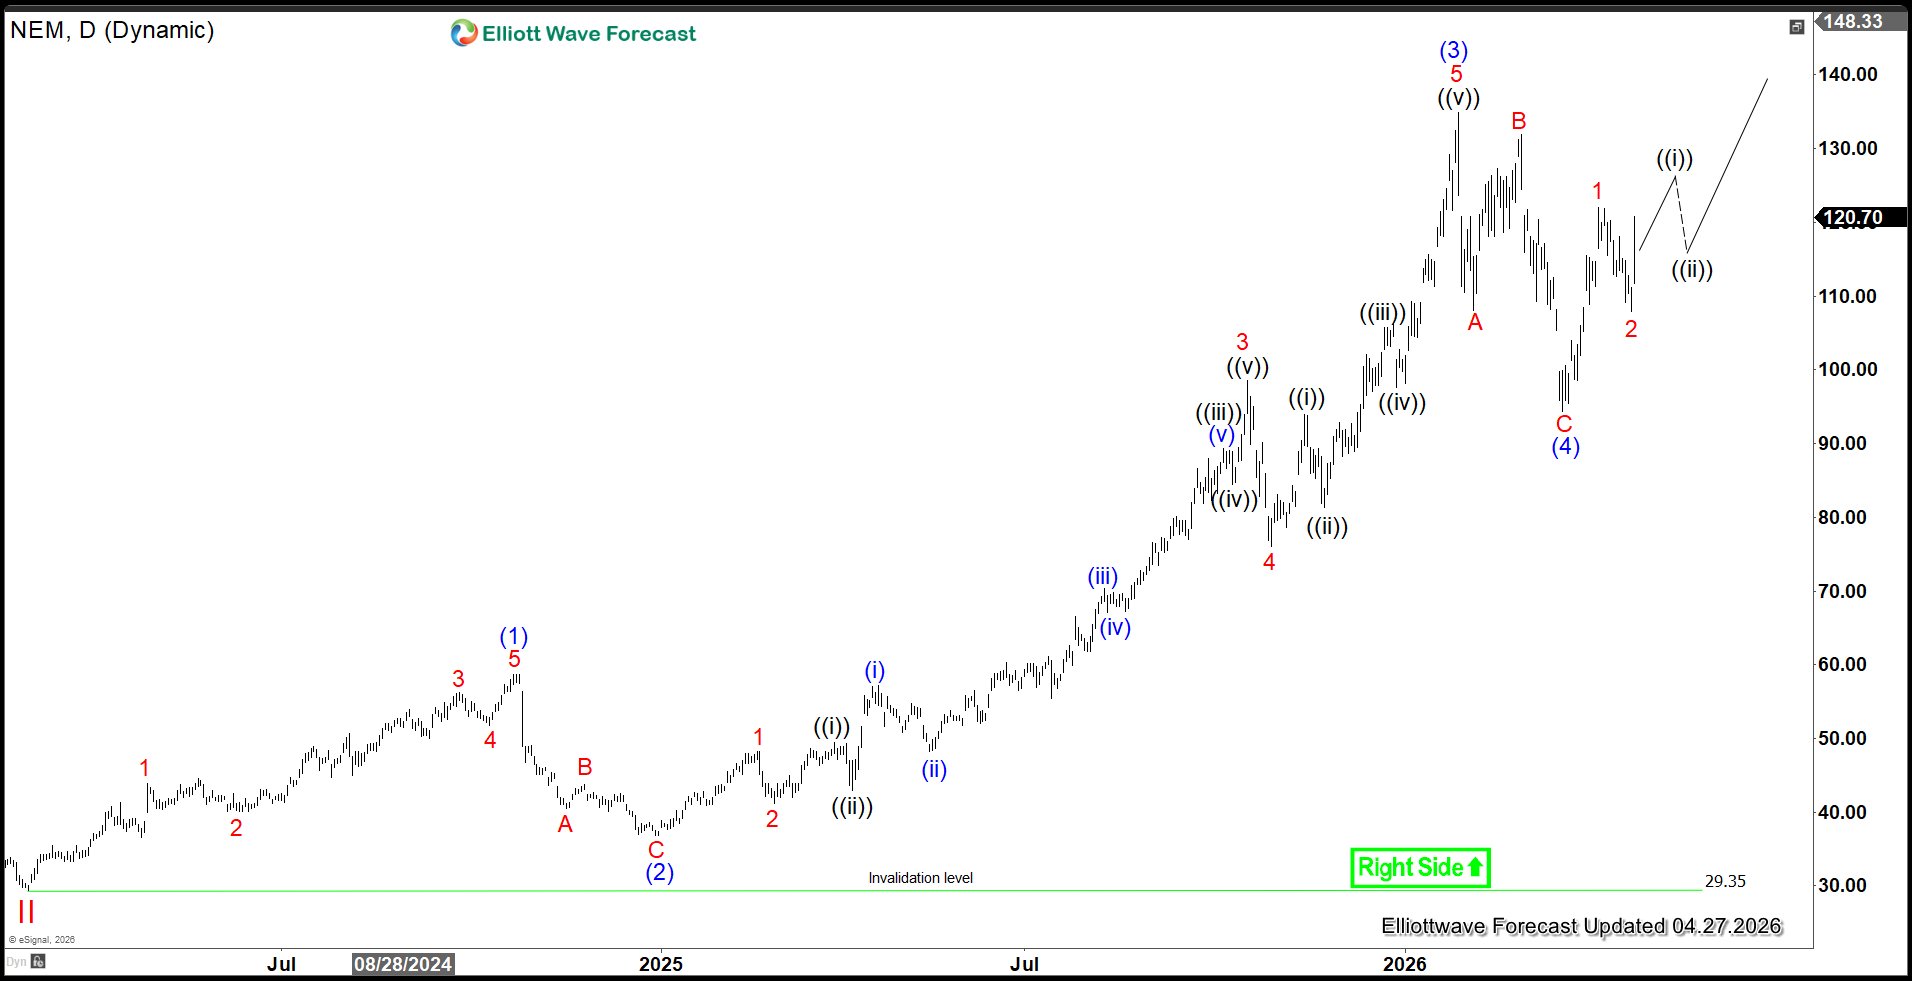
Newmont (NEM) Elliott Wave Structure Signals Extension Higher
Newmont Mining (NEM), the world’s largest gold producer, remains a pivotal asset in the resource sector and a key proxy for broader precious metals trends. Its price action has consistently reflected both macroeconomic cycles and investor sentiment toward gold, while its Elliott Wave structure highl
elliottwaveforecast
24 Apr
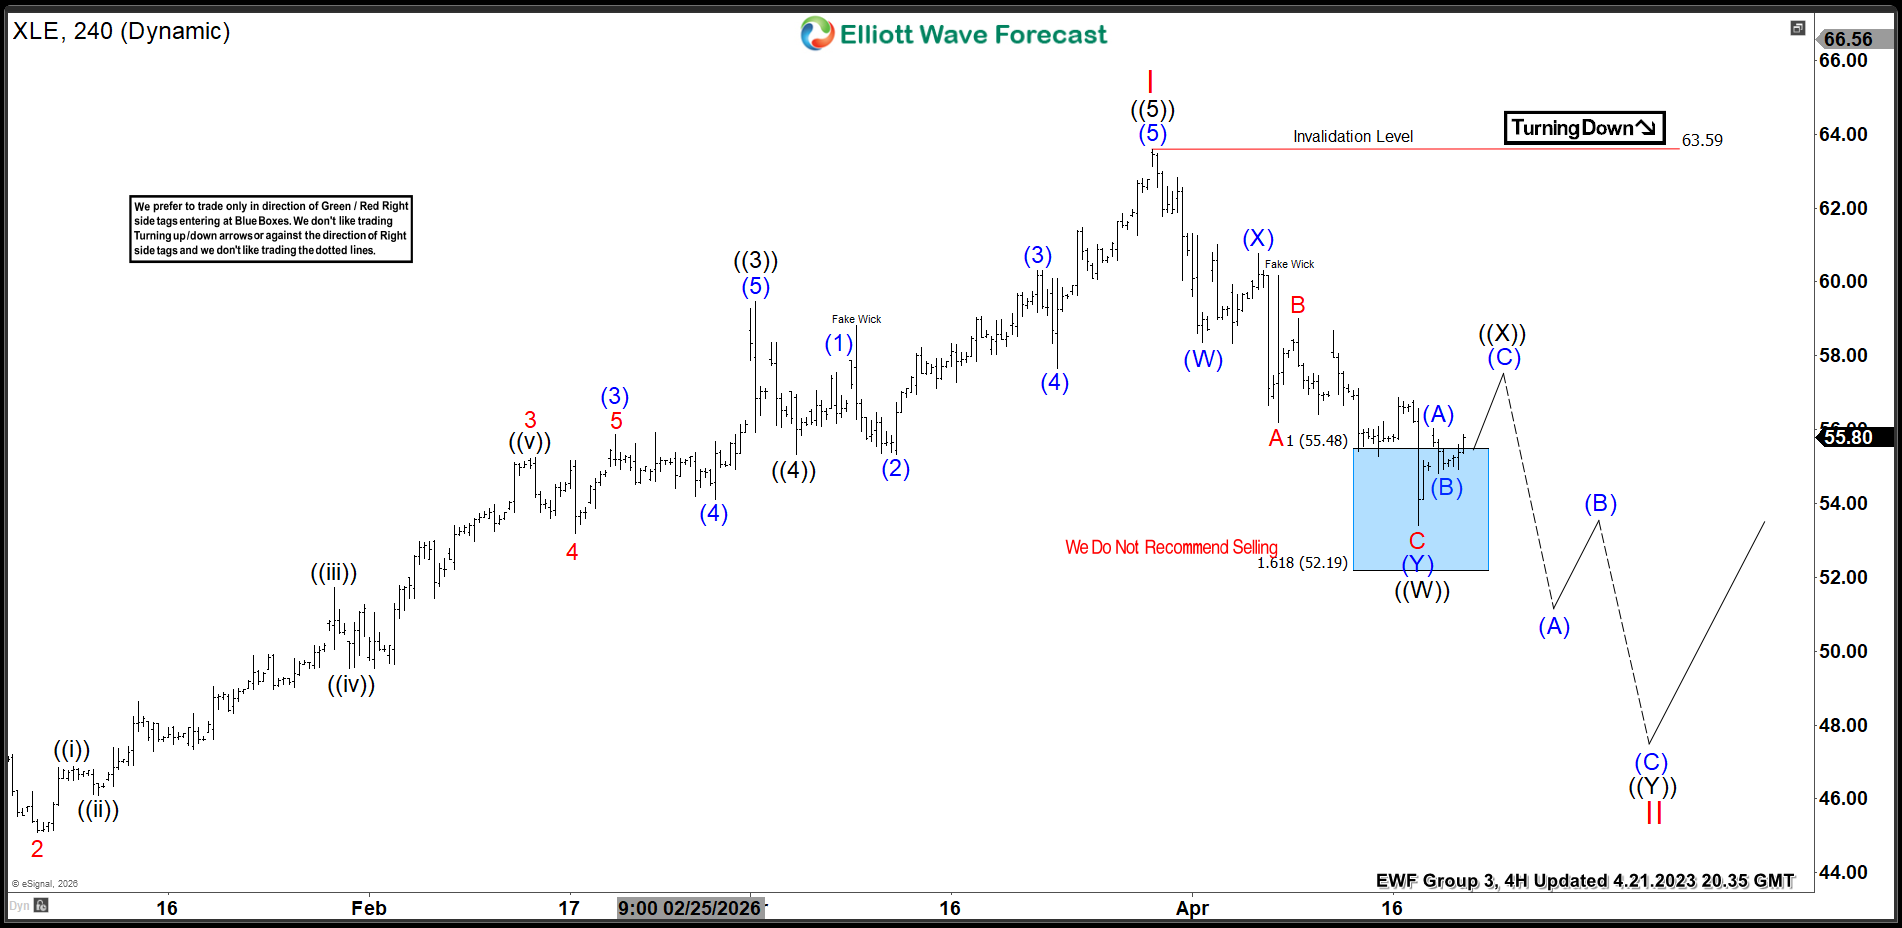
$XLE Elliott Wave Forecast: Reaction Higher Starts After Blue Box Support
In this Elliott Wave update, we look at the latest price action in Energy Select Sector SPDR Fund ($XLE). The ETF extended lower into the short-term blue box area at 55.48–52.19 and ended the cycle from the 3/30 peak. As expected, buyers appeared in that zone and triggered a reaction higher. Therefo
elliottwaveforecast
21 Apr
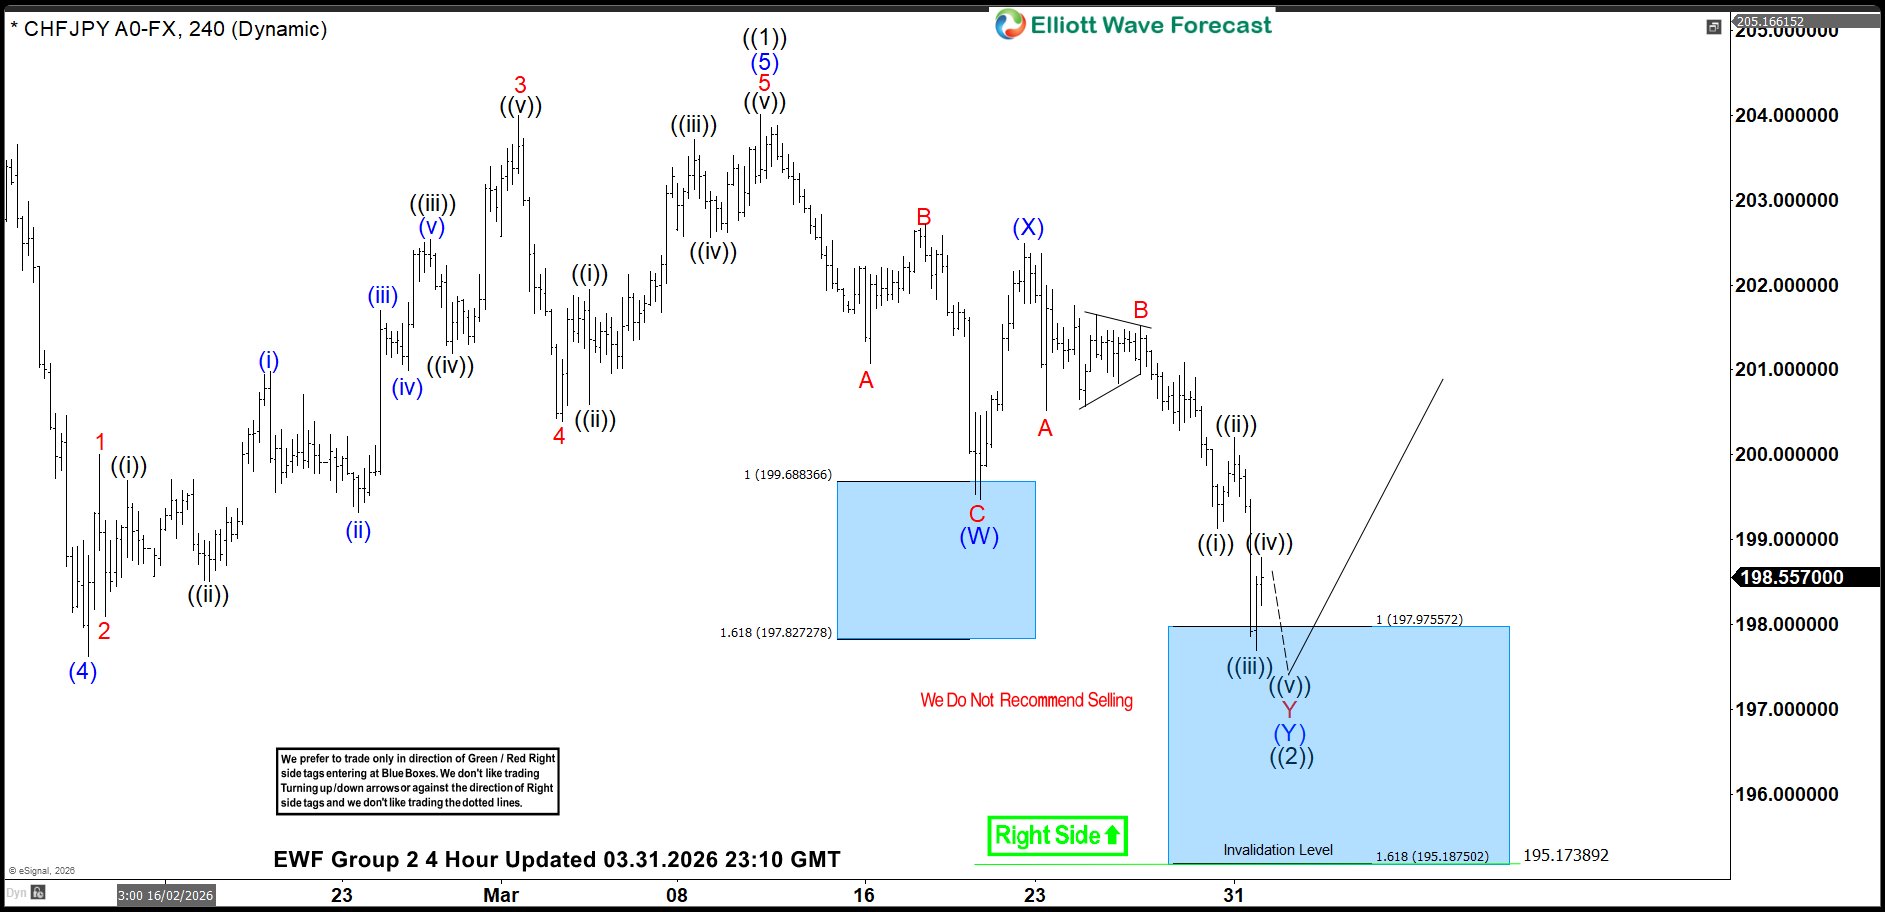
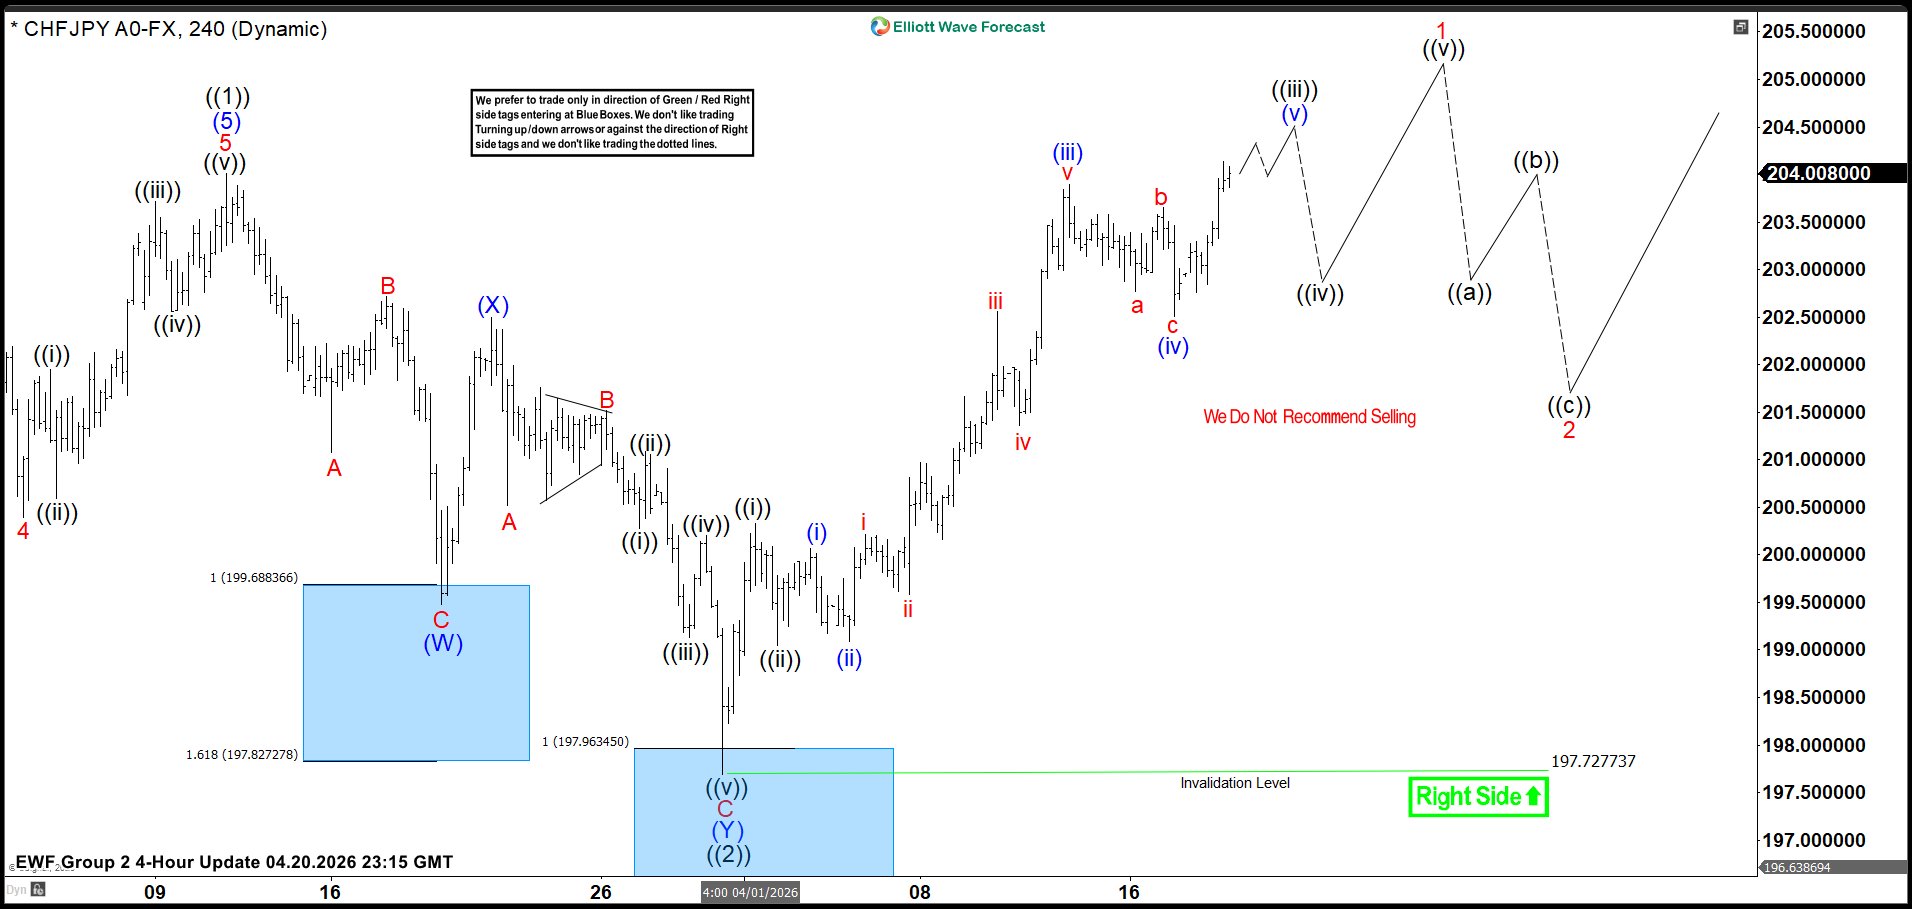
CHFJPY Achieves New Highs from Blue Box Zone
In this technical blog, we will look at the past performance of the 4-hour Elliott Wave Charts of CHFJPY. In which, the rally from September 2024 low is unfolding as an impulse sequence. Therefore, called for more upside to take place. We knew that the structure in the pair should remains incomplete
elliottwaveforecast
21 Apr
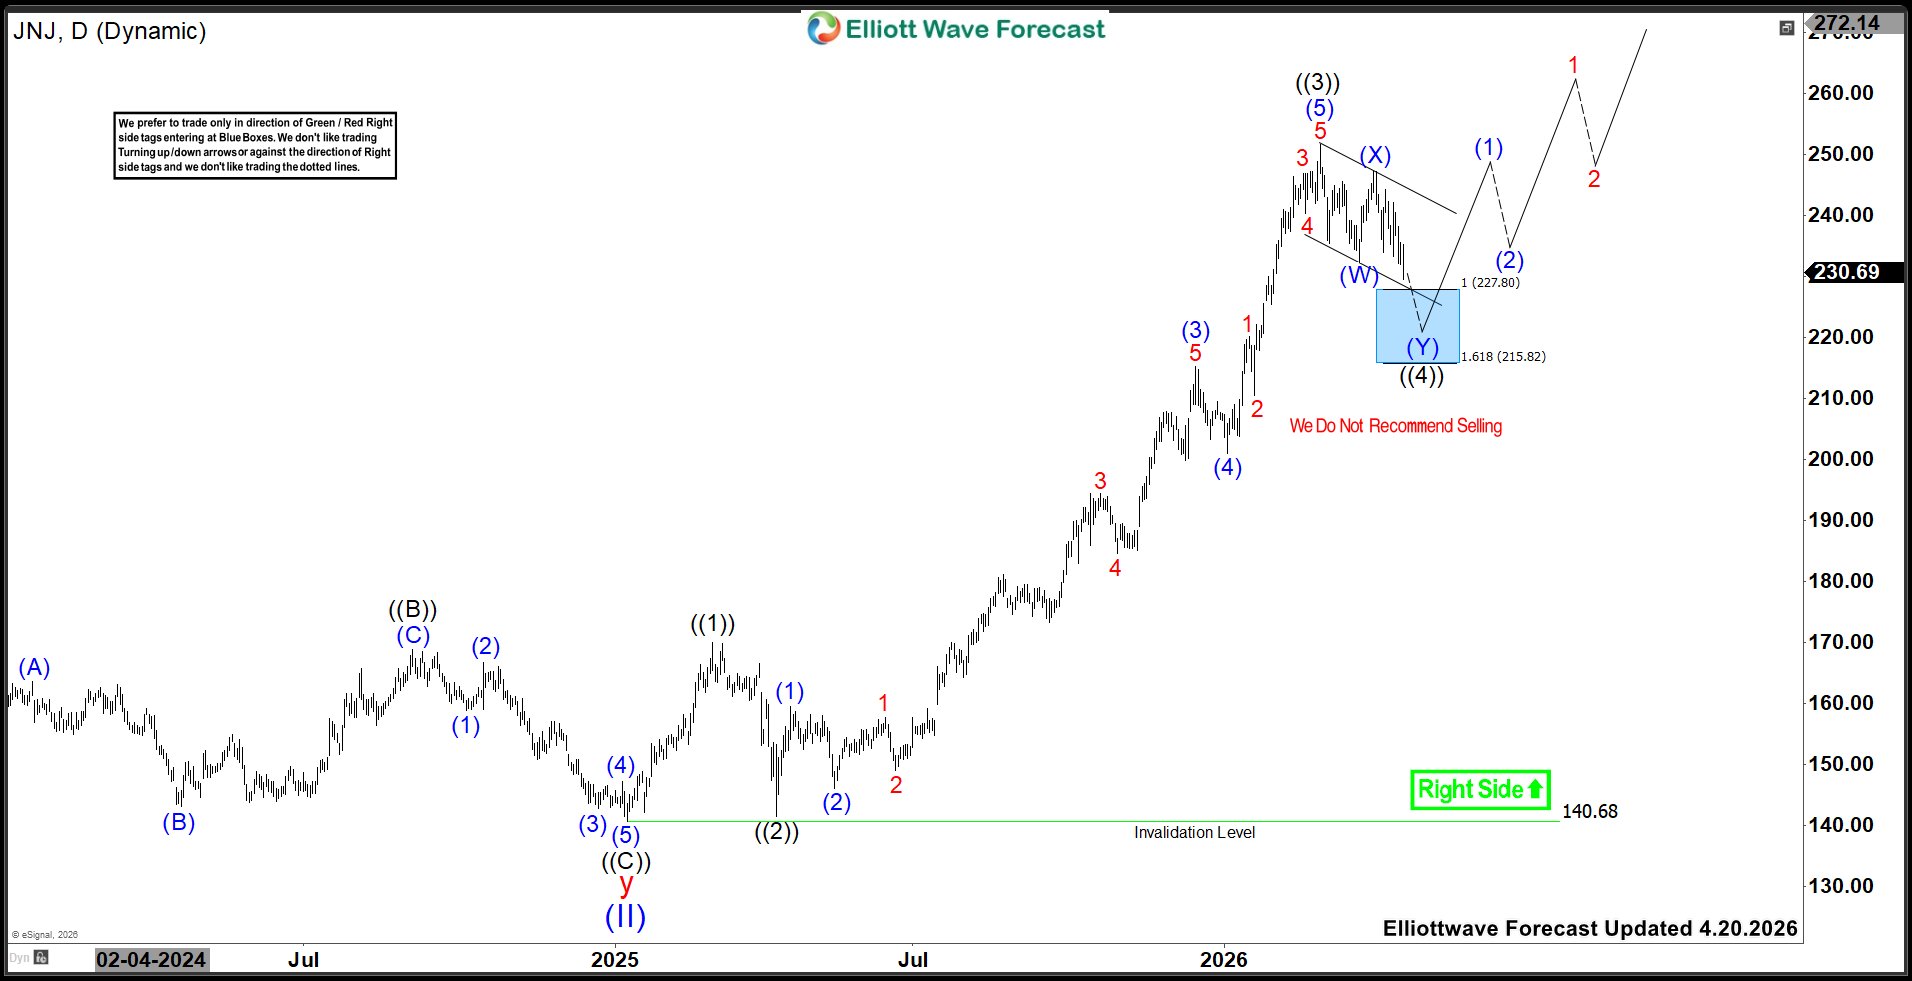
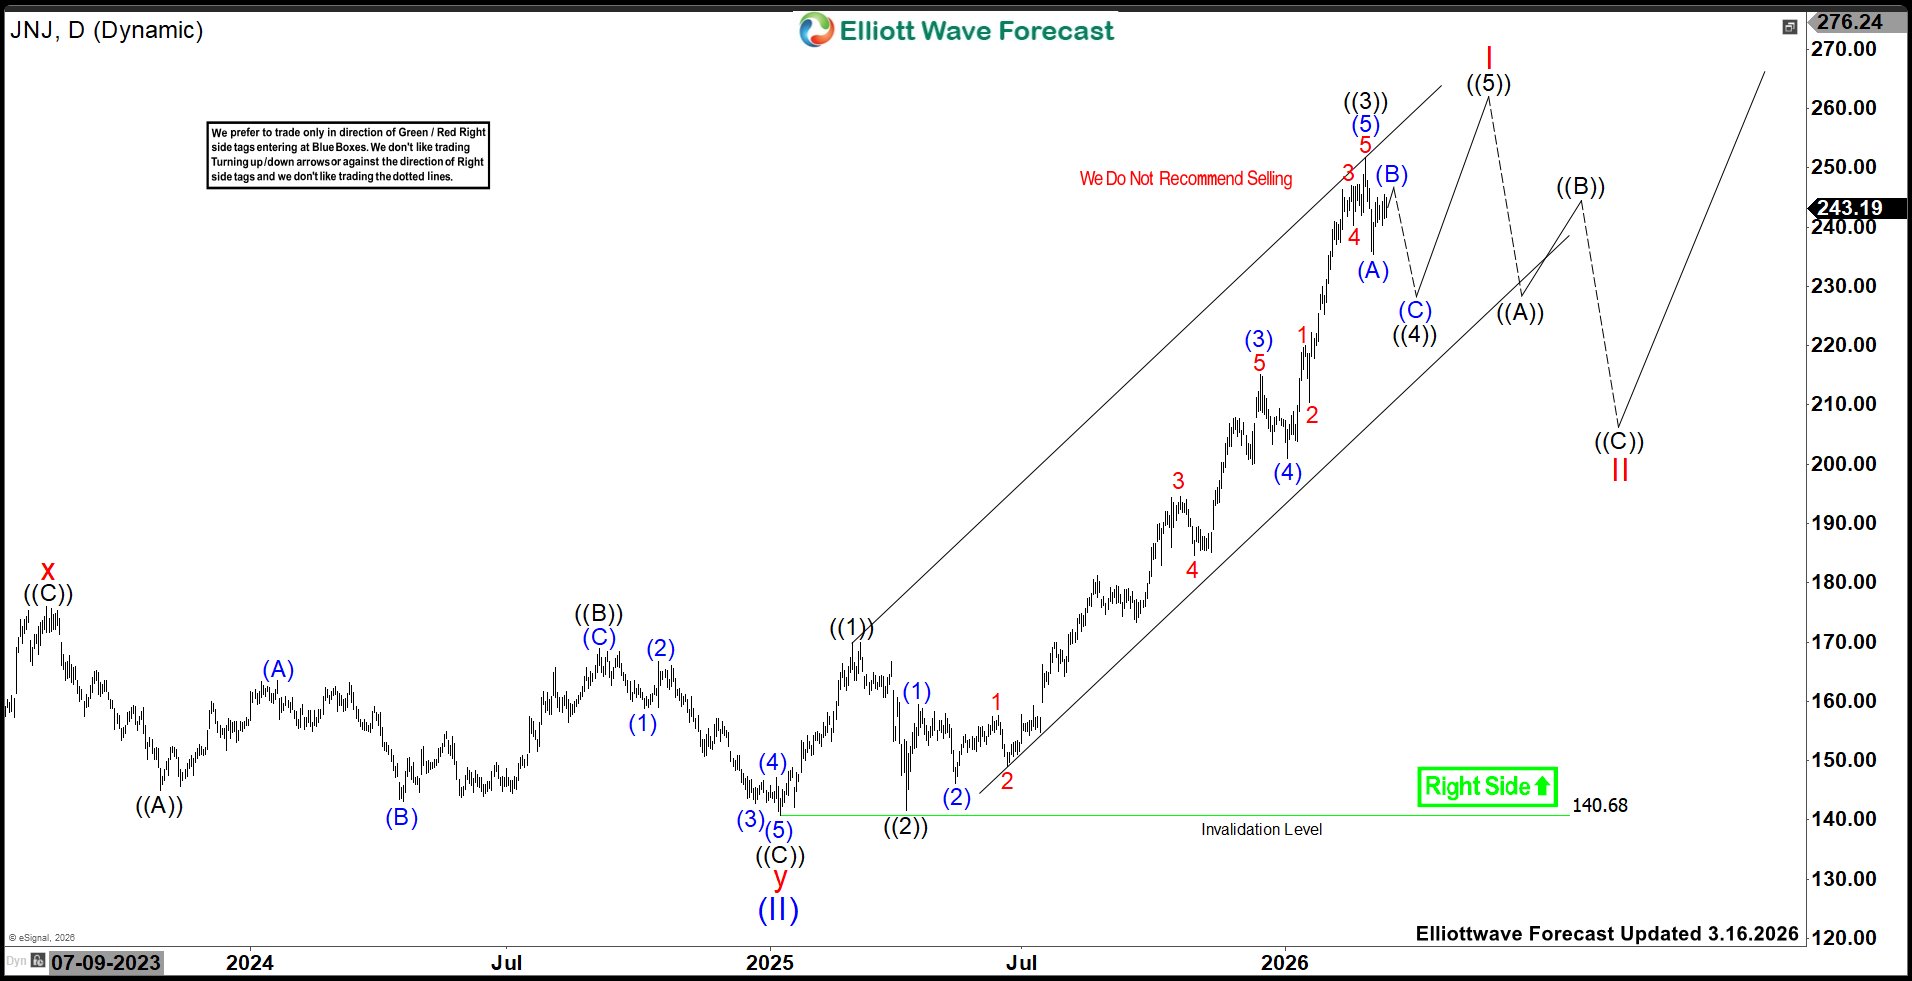
Johnson & Johnson (JNJ) Forecast: Buyers Should Enter Between 227.8 - 215.8 Area
Johnson & Johnson (JNJ) engages in research & development, manufacture & sale of range of products in the healthcare sector worldwide. It operates through Innovative Medicine & MedTech. It comes under Healthcare sector & trades as “JNJ” at NYSE. The JNJ favors rally in bullish se
elliottwaveforecast
21 Apr
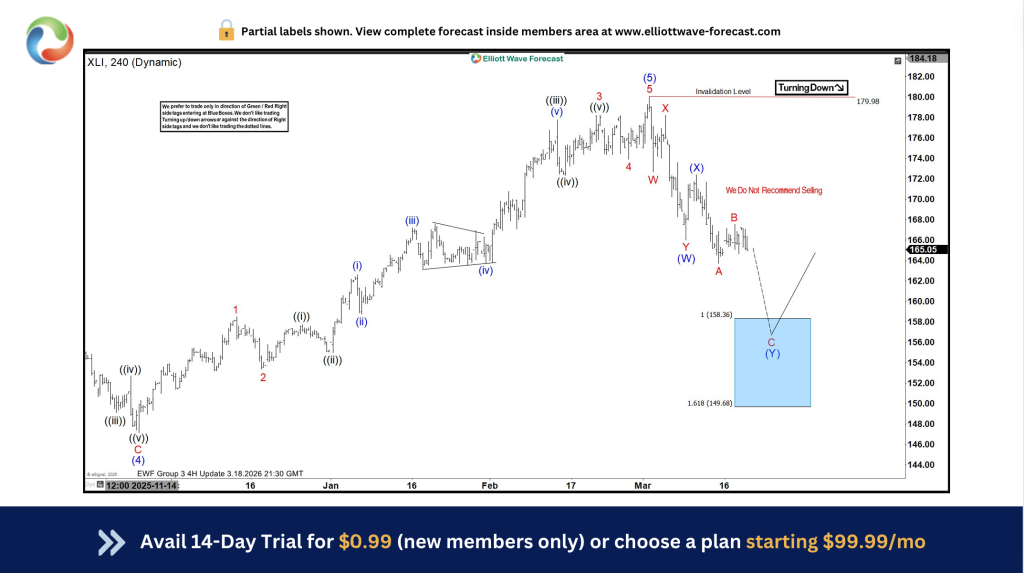
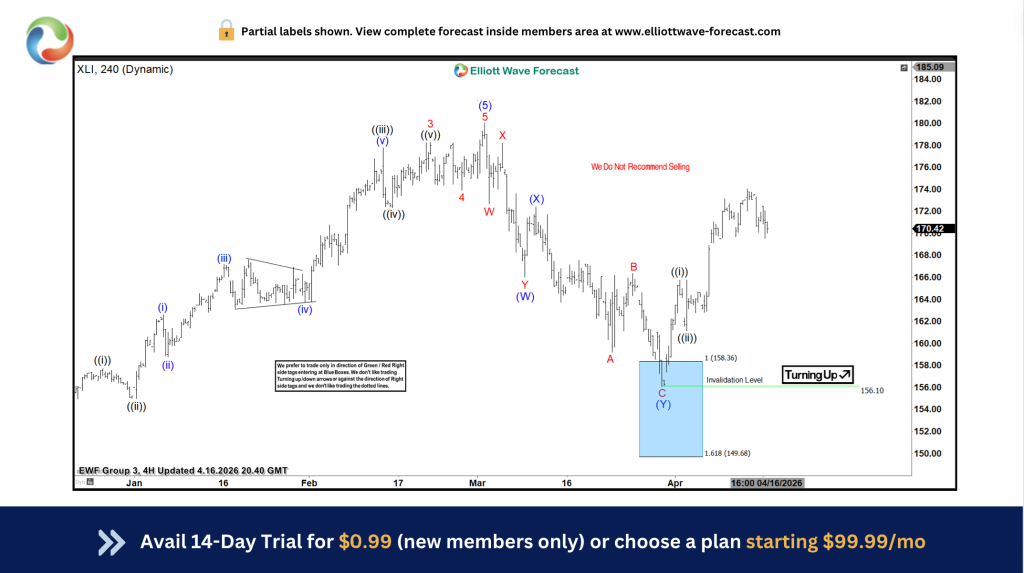
Elliott Wave Setup: XLI stays bullish from Blue Box Support
Industrial Select Sector SPDR Fund (XLI) ended the March 2026 pullback at the point where Elliott Wave Forecast Blue Box recommended members to go long. What's next following this rebound? The US Industrial sector has been one of the most profitable since the turn of the millennium. The XLI ETF esta
elliottwaveforecast
16 Apr
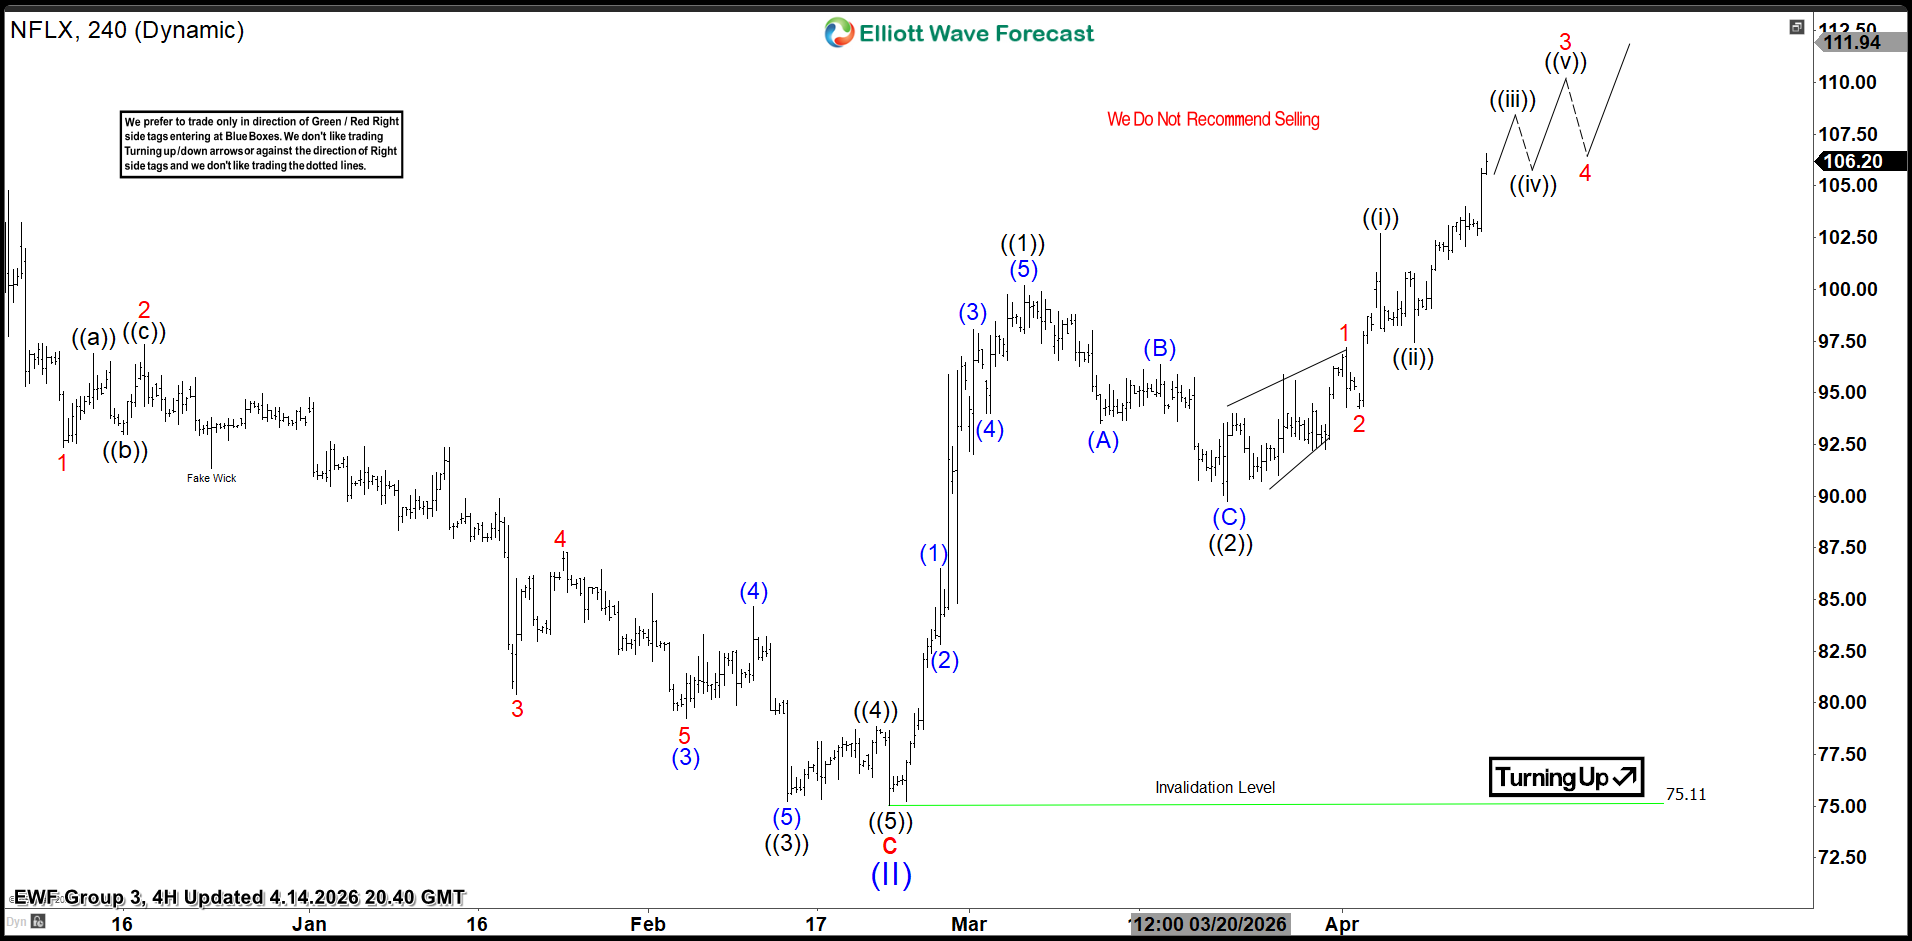
$NFLX Elliott Wave Forecast: Incomplete Bullish Sequence Points to 115–130
In this Elliott Wave update, we take a look at the latest structure in Netflix Inc. ($NFLX). The stock continues to show an incomplete bullish sequence, which suggests that higher prices should still be seen before the current move is finished. As a result, the next upside area to watch comes at 115
elliottwaveforecast
15 Apr
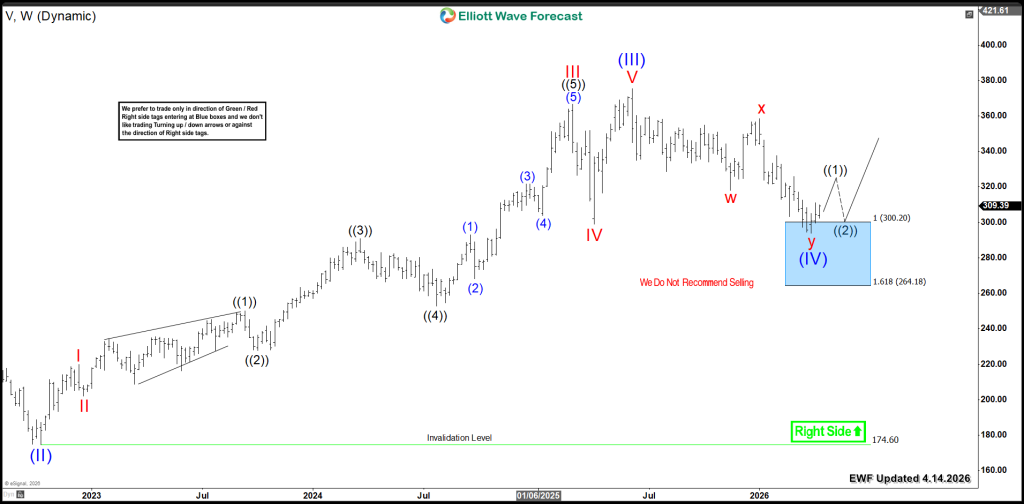
Visa (V) Establishes $300 Base, Eyes $400 Next
Last year, we explained Visa (NYSE: V) bullish sequence and outlined the reasons for more upside. Now that this cycle has ended, we analyze the recent weekly correction. This pullback presents a fresh investment opportunity. Therefore, we update our bullish view for the stock. Looking at Visa's Elli
elliottwaveforecast
15 Apr
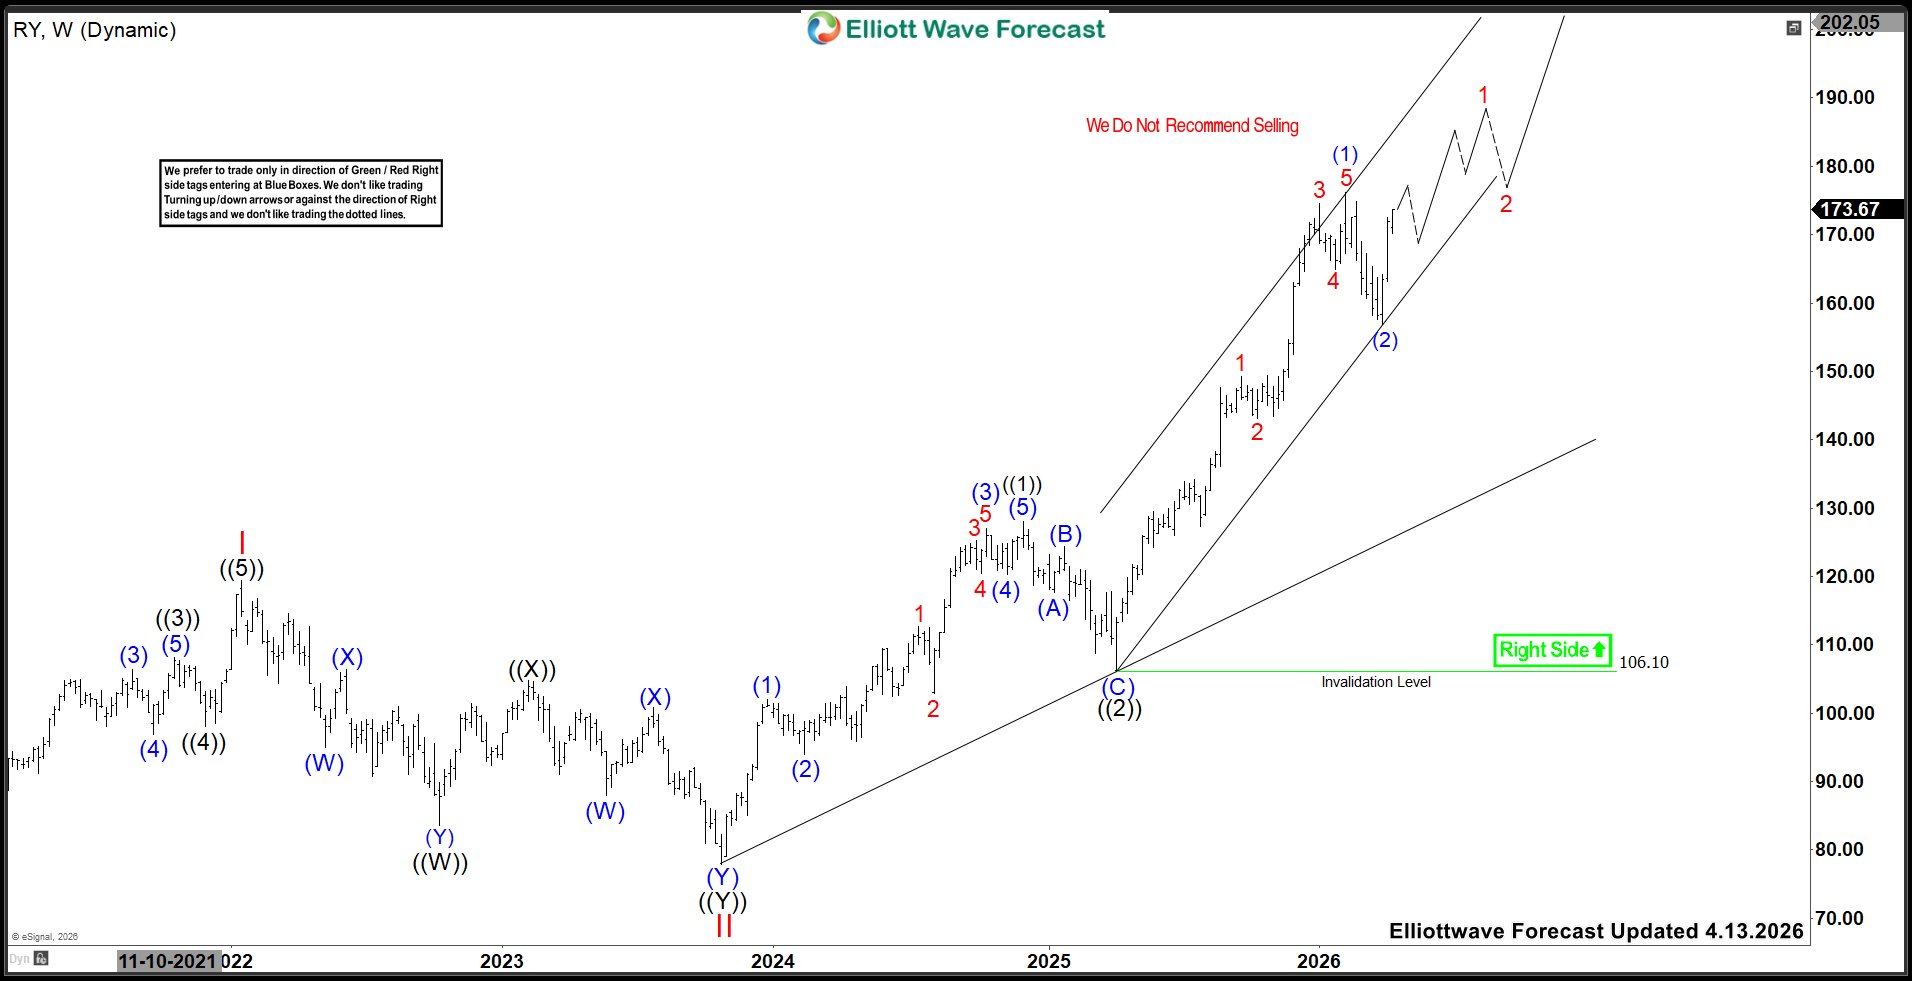
Royal Bank of Canada (RY): Elliott Wave Signals Strong Upside Toward $226
Royal Bank of Canada., (RY) operates as diversified financial service company worldwide. It operates through personal finance, commercial banking, wealth management & Insurance segments. It comes under Financial services sector & trades as “RY” ticker at NYSE. RY favors nesting within Octobe