Our earlier review highlighted Robinhood's (NASDAQ: HOOD) bullish five-swing structure. Currently, we are analyzing the weekly Elliott Wave pattern. This study clarifies the ongoing correction and prepares us for the next strategic phase ahead of a new bullish cycle.
Elliott Wave Analysis
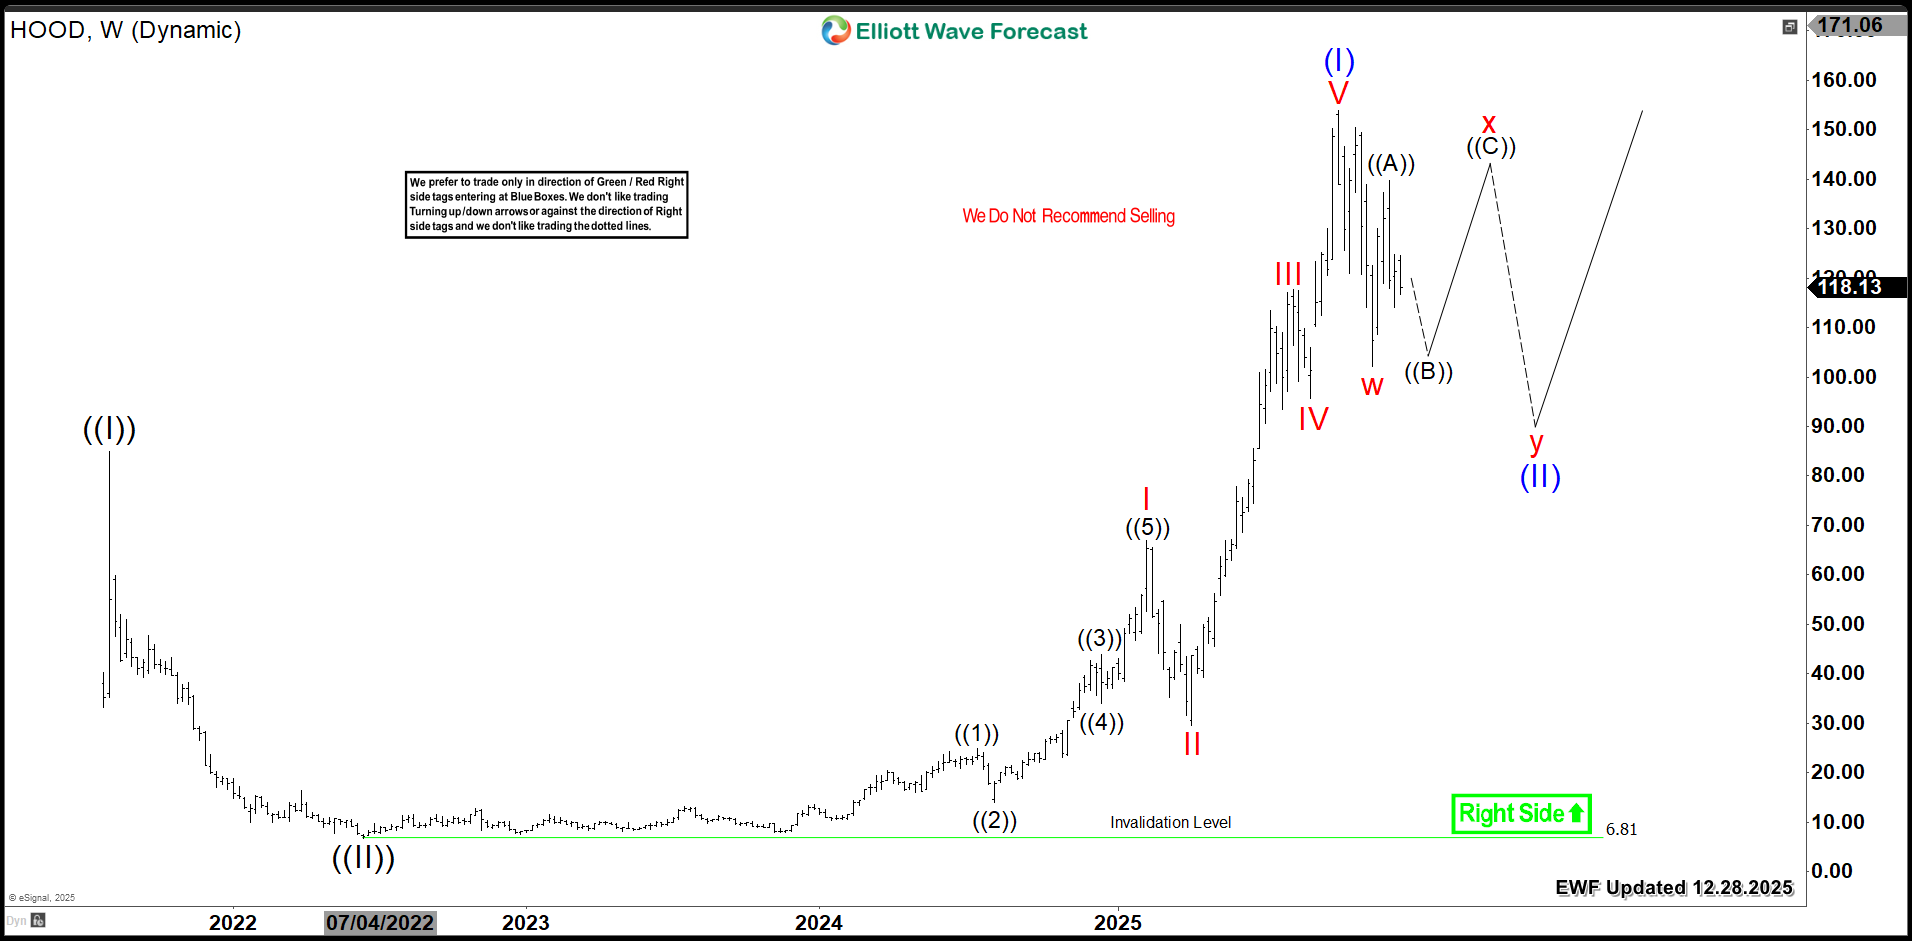
HOOD completed a five-wave advance from its 2022 low of $6.81. This rally peaked at $153.86, marking wave (I). Consequently, the stock now requires a corrective phase. This pullback will form as a 3, 7, or 11-swing pattern before the uptrend resumes.
Currently, HOOD finished the first three swings from the peak. This move ended at $102.10 as wave 'w'. Now, wave 'x' is in progress. Subsequently, wave 'y' will drive prices lower. This decline could reach the $80 - $63 Fibonacci retracement zone (50% - 61.8%).
Once wave (II) finishes, Robinhood will launch wave (III). This new cycle should become the strongest rally within the nesting structure from its all-time low.
HOOD Weekly Chart 12.28.2025
Conclusion
HOOD's weekly bullish cycle remains firmly intact. Therefore, investors should target buying opportunities within weekly pullbacks. Utilize our Elliott Wave strategy for precise entry timing. Specifically, establish positions after a 3, 7, or 11-swing correction completes. Additionally, our proprietary Blue Box system pinpoints high-probability entry zones. Consequently, this disciplined method provides clarity and confidence. Ultimately, it positions traders to capture the next major bullish leg.
Tuyên bố miễn trừ trách nhiệm: Quan điểm được trình bày hoàn toàn là của tác giả và không đại diện cho quan điểm chính thức của Followme. Followme không chịu trách nhiệm về tính chính xác, đầy đủ hoặc độ tin cậy của thông tin được cung cấp và không chịu trách nhiệm cho bất kỳ hành động nào được thực hiện dựa trên nội dung, trừ khi được nêu rõ bằng văn bản.

Để lại tin nhắn của bạn ngay bây giờ