Date: January 5, 2026 | Time: 08:41 AM (UTC 5)
Current Price Action & Key Observations
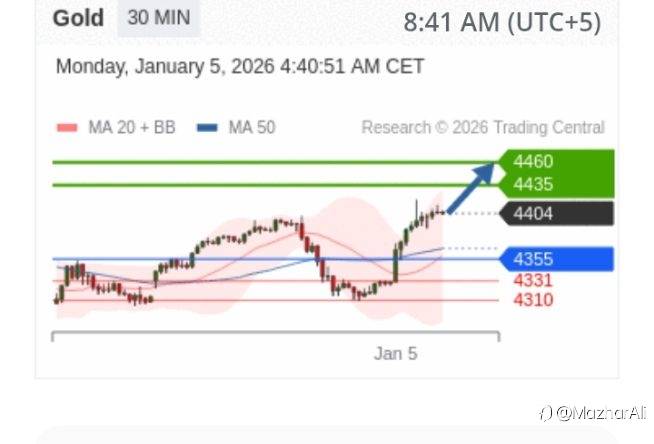
Gold is currently trading near 4,404, positioned between the 20-period MA Bollinger Band and the 50-period MA, indicating a consolidation phase with a bullish bias. The price is holding above the critical pivot level of 4,355, reinforcing near-term strength.
Key Technical Levels
· Resistance:
1. 4,435 (Primary Target)
2. 4,460 (Extension Target)
· Pivot: 4,355 (Intraday Bias Level)
· Support:
1. 4,331 (Initial Support)
2. 4,310 (Secondary Support)
Indicator Analysis
· Moving Averages: Price above MA 50 suggests underlying bullish momentum. The MA 20 Bollinger Band provides dynamic resistance near current levels.
· RSI (Relative Strength Index): In bullish territory, supporting further upward movement.
· Price Structure: Higher lows formation above 4,355 aligns with the bullish intraday bias.
Trade Strategy
Primary Bias: Bullish
· Entry Zone: Long positions on pullbacks towards 4,355–4,360.
· Targets:
· First Target: 4,435
· Extended Target: 4,460
· Stop Loss: Below 4,331 (or 4,310 for wider risk management).
Alternative Scenario (If Pivot Breaks):
· A break below 4,355 could trigger a correction towards 4,331 and 4,310.
· Consider short positions only if price sustains below 4,355 with confirmation.
Market Context & Notes
· The analysis is based on a 30-minute timeframe, suitable for intraday trading.
· The bullish RSI and price holding above key moving averages suggest buyers remain in control.
· Monitor 4,355 closely—this level now acts as a decisive line between bullish continuation and a deeper pullback.
Tuyên bố miễn trừ trách nhiệm: Quan điểm được trình bày hoàn toàn là của tác giả và không đại diện cho quan điểm chính thức của Followme. Followme không chịu trách nhiệm về tính chính xác, đầy đủ hoặc độ tin cậy của thông tin được cung cấp và không chịu trách nhiệm cho bất kỳ hành động nào được thực hiện dựa trên nội dung, trừ khi được nêu rõ bằng văn bản.

-KẾT THÚC-