Citigroup (NYSE: C) resumed its bullish trend despite an early correction this year. The stock broke again to new all-time highs. Today, we dive into its daily technical chart. Our analysis explores the Elliott Wave structure currently supporting the rally.
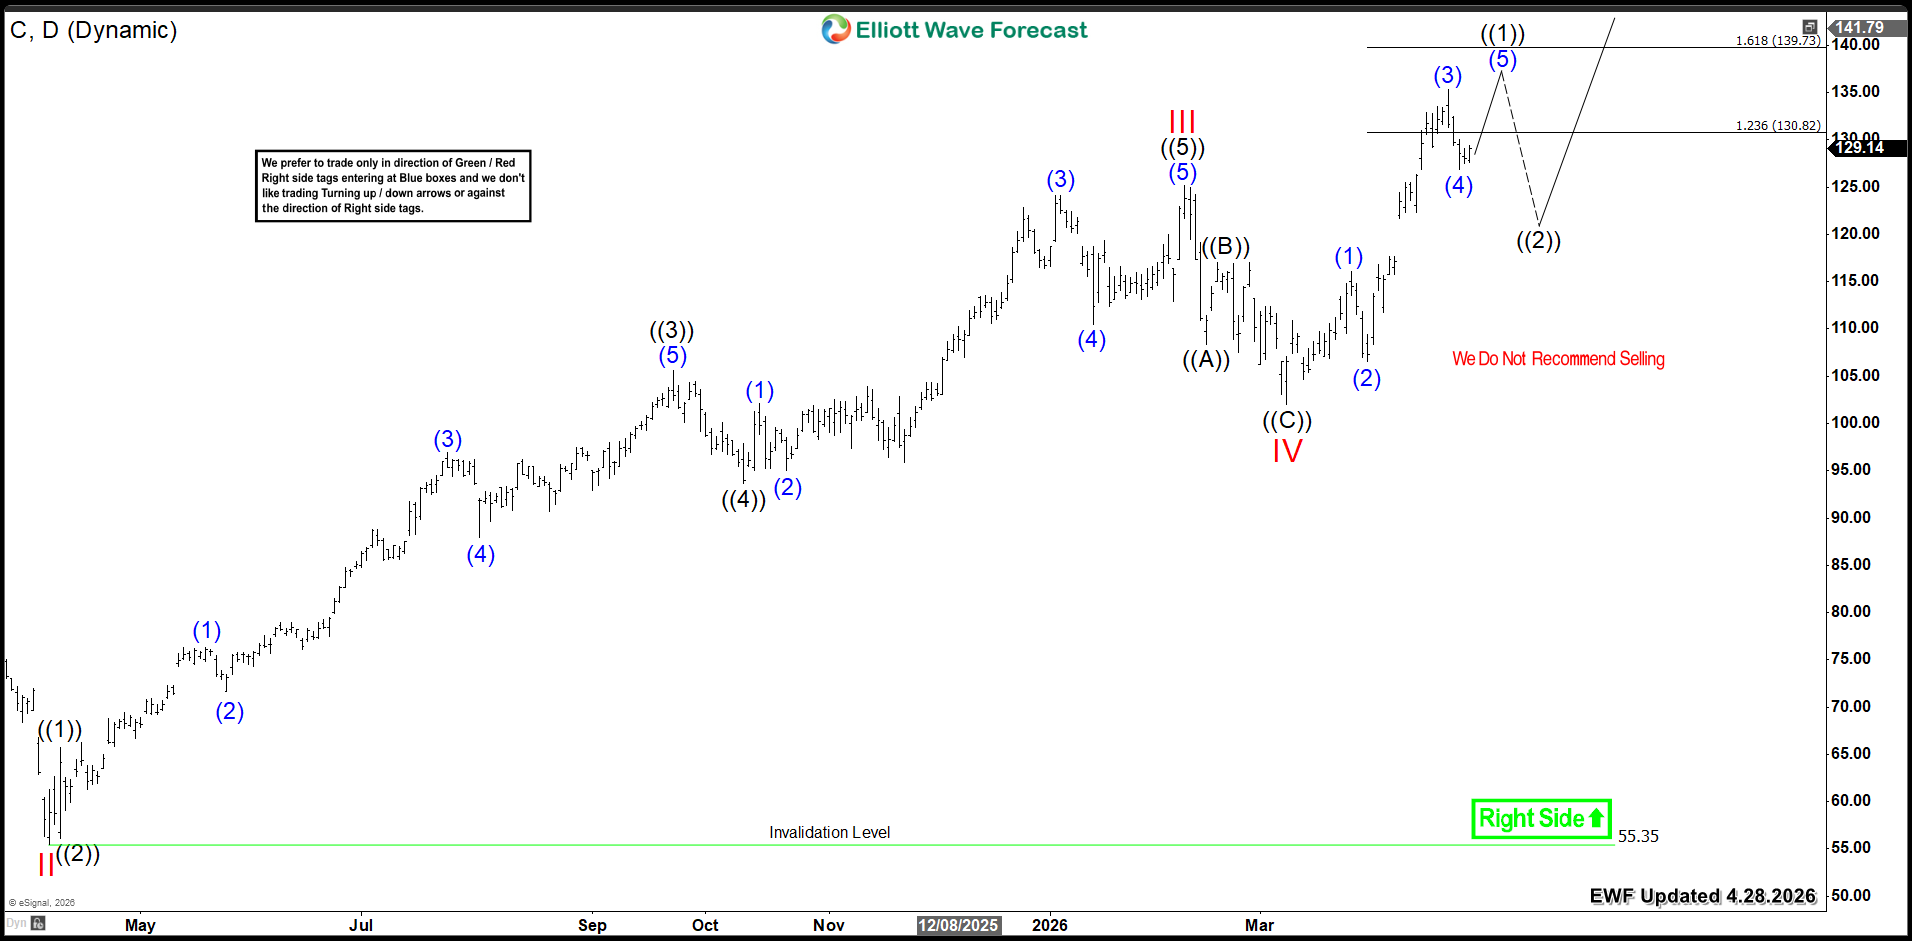
Looking at Citigroup's daily chart, the cycle from the 2025 low has ended. A five-wave advance marked wave III at $125. After that peak, the stock corrected lower in a zigzag structure. This wave IV pullback reached $102. From there, C resumed its rally to new all-time highs. Currently, it shows three swings higher from the March 2026 low. This suggests another move up before completing a five-wave advance.
The stock is trading within the $130−$139 inverted Fibonacci extension zone. C should end wave ((1)) at this target area. Then, a wave ((2)) pullback will occur. Price must remain supported above $102. Any pullback should attract buyers. This will allow the cycle to extend higher above $150.
Citigroup C Daily Chart 4.28.2026
Conclusion
Citigroup's (C) bullish cycle remains in progress as the stock is looking for further upside extension. Therefore, investors should target buying opportunities within daily pullbacks.
Tuyên bố miễn trừ trách nhiệm: Quan điểm được trình bày hoàn toàn là của tác giả và không đại diện cho quan điểm chính thức của Followme. Followme không chịu trách nhiệm về tính chính xác, đầy đủ hoặc độ tin cậy của thông tin được cung cấp và không chịu trách nhiệm cho bất kỳ hành động nào được thực hiện dựa trên nội dung, trừ khi được nêu rõ bằng văn bản.

Để lại tin nhắn của bạn ngay bây giờ