#candlestick#
1.94k Xem
207 Thảo luận
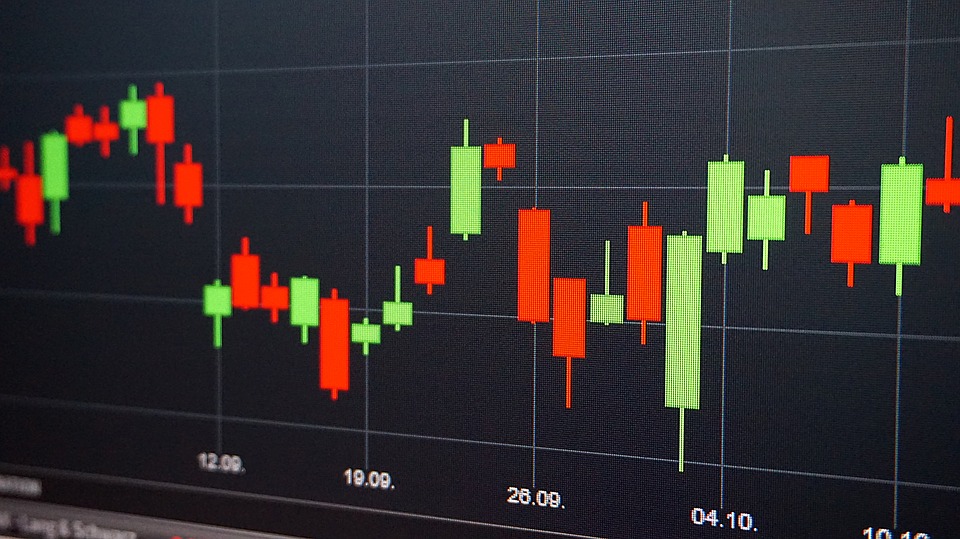
A candlestick chart (also called Japanese candlestick chart) is a style of financial chart used to describe price movements of a security, derivative, or currency. Each "candlestick" typically shows one day, thus a one-month chart may show the 20 trading days as 20 candlesticks. Candlestick charts can also be built using intervals shorter or longer than one day.
Belajar Candlestick Forex: Panduan Lengkap Baca Pergerakan Harga & Psikologi Pasar
Percuma lo pasang 10 indikator warna-warni kalau satu batang candle aja lo nggak paham maksudnya apa. Di market, harga itu raja. Dan cara harga "ngomong" sama kita ya lewat candlestick. Kalau lo mau serius belajar candlestick forex, buang dulu mindset kalau trading itu cuma soal nyari sinyal hijau a

- Notes by Bayu :kwkwk

- 奥格瑞玛 :nice picture
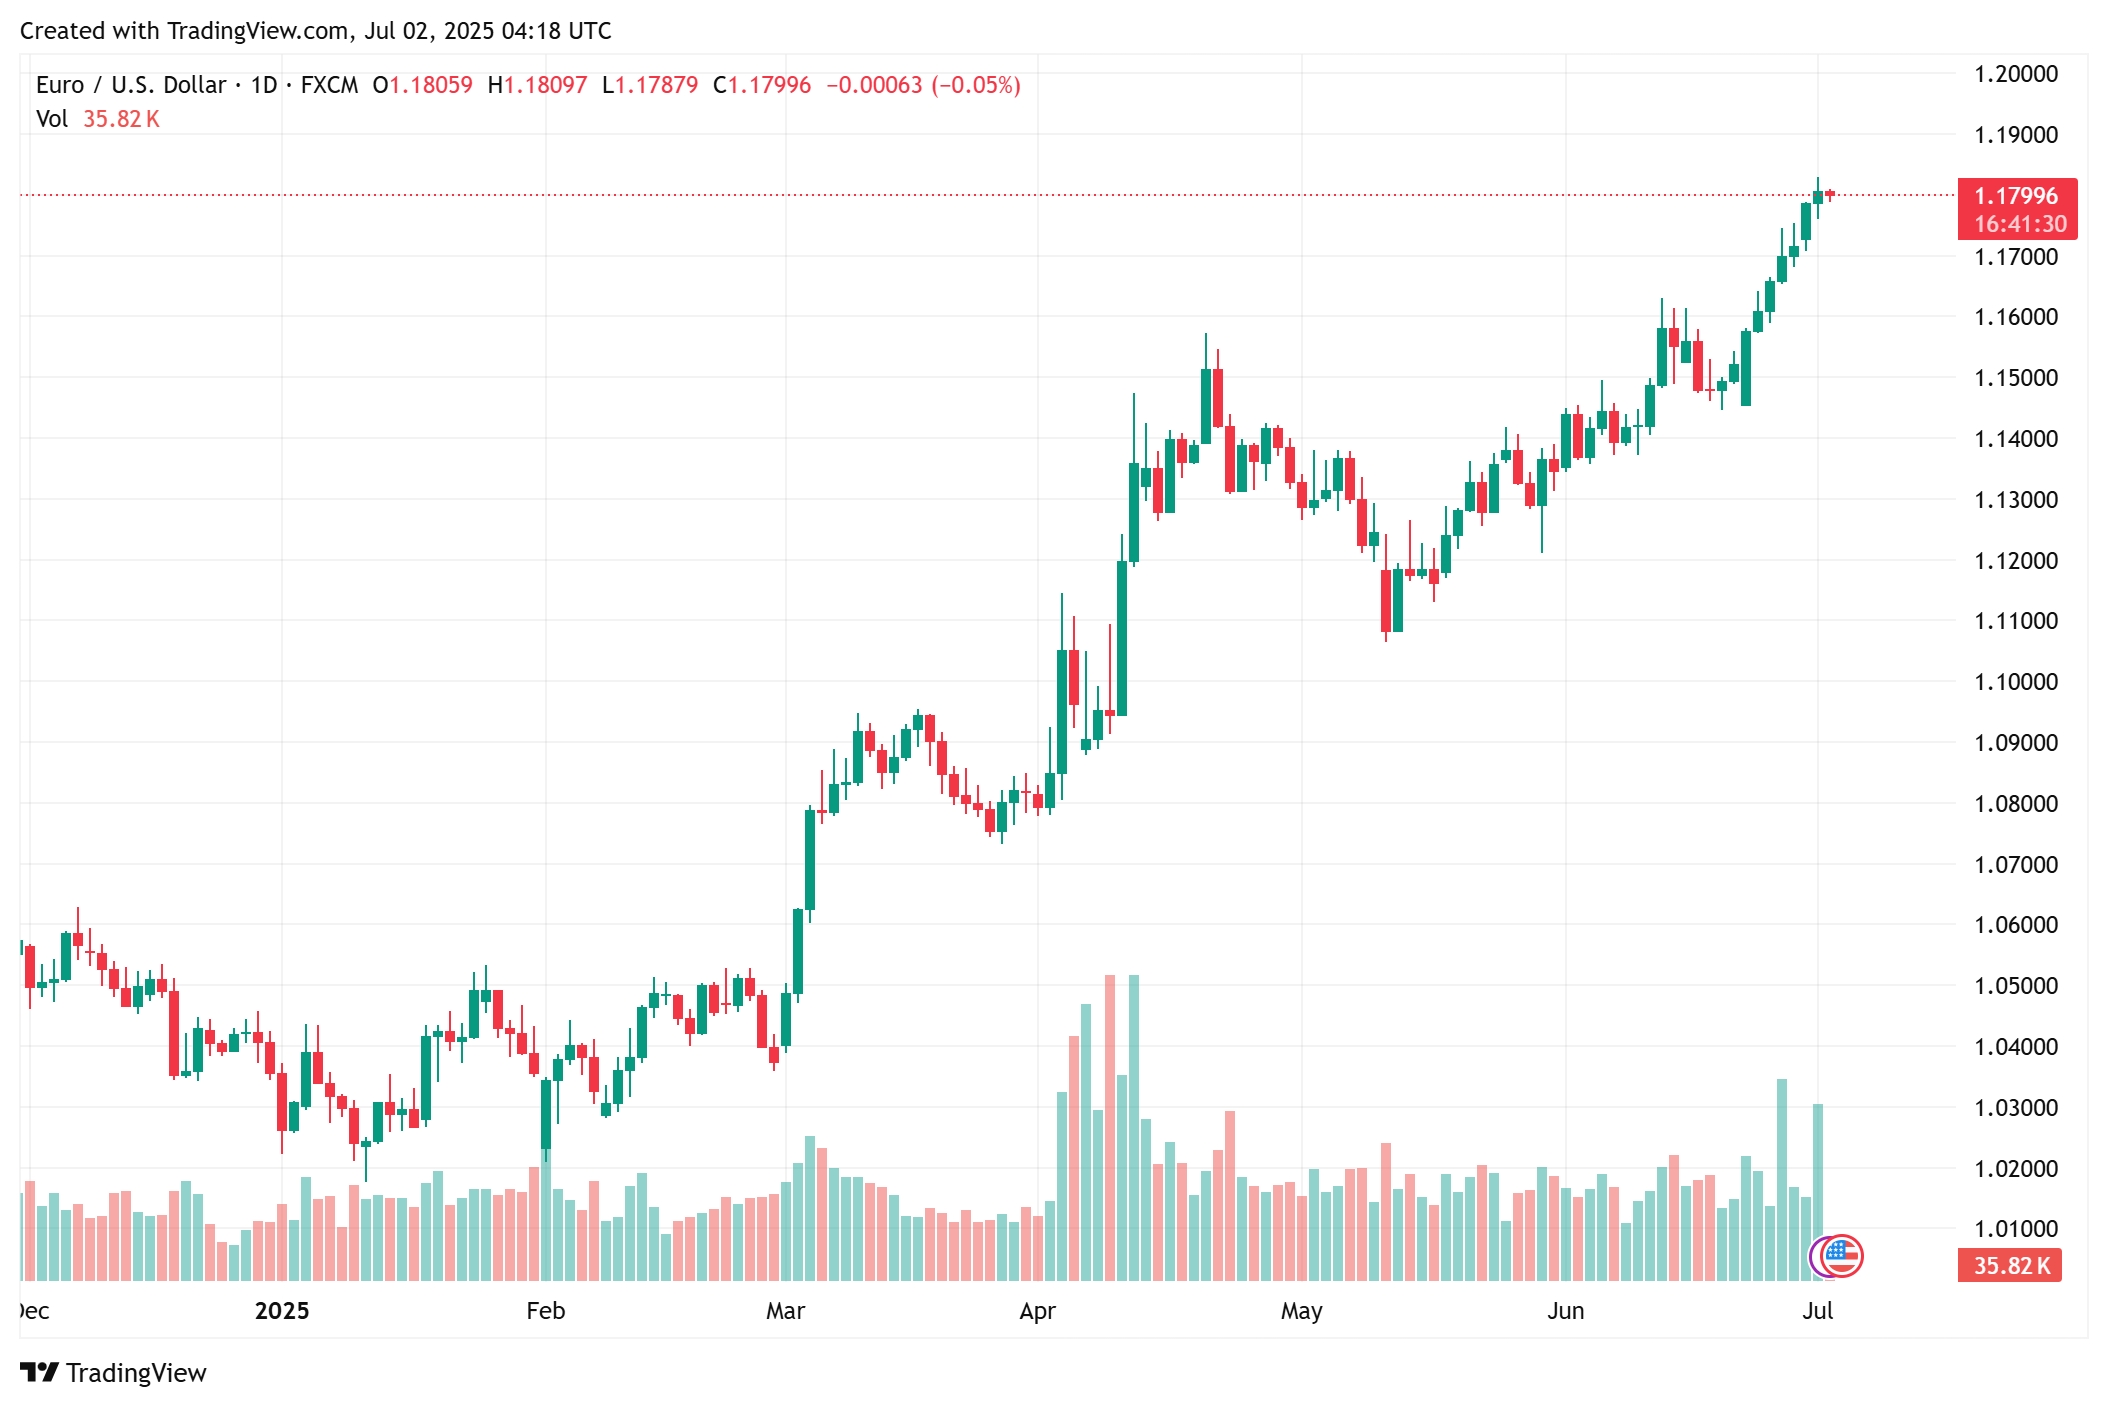
Line Chart Forex, Simpel Tapi Efektif
Awal belajar forex, gue suka bingung sama candlestick chart karena keliatan ribet. Akhirnya coba pakai line chart forex, dan ternyata jauh lebih gampang buat lihat arah trend. Dengan line chart, lo bisa fokus ke pergerakan harga closing tiap periode. Jadi lebih bersih, cocok banget buat pemula yang


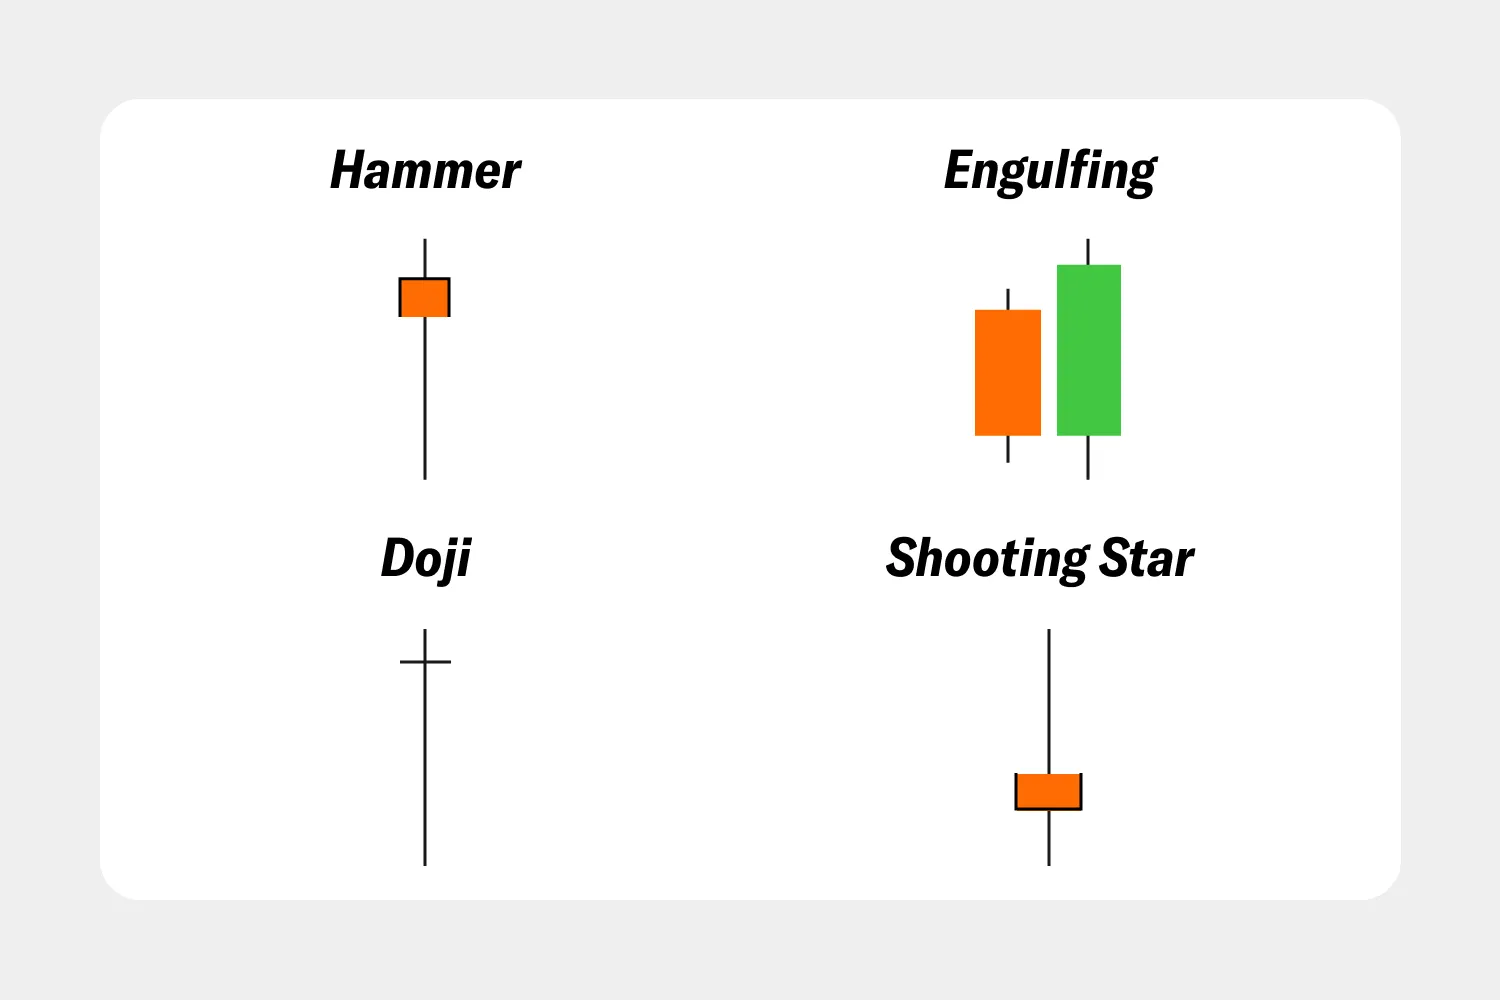
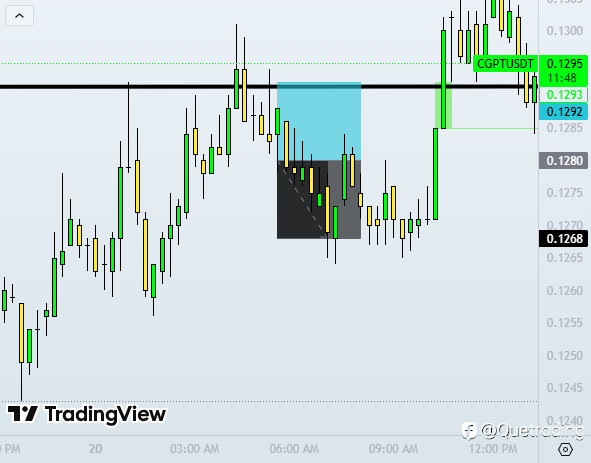
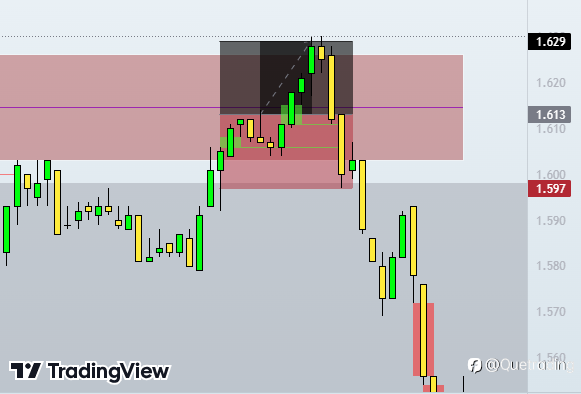
Momen Tepat Entry dengan Candlestick Pattern
Candlestick pattern seperti Doji, Hammer, dan Engulfing sering jadi sinyal pembalikan arah harga. Contohnya, Hammer di support bisa menandakan pembalikan dari downtrend ke uptrend. Tapi jangan asal pakai, selalu lihat konfirmasi dari volume dan tren utama.