
#USeconomy#
U.S. GDP (2016 - 2020)

The Real Gross Domestic Product (GDP) increased in the third quarter of 2020 at an annual rate of 33.4%. According to the estimated release of the Real GDP by the Bureau of Economic Analysis. In the second quarter, real GDP decreased 31.4%.
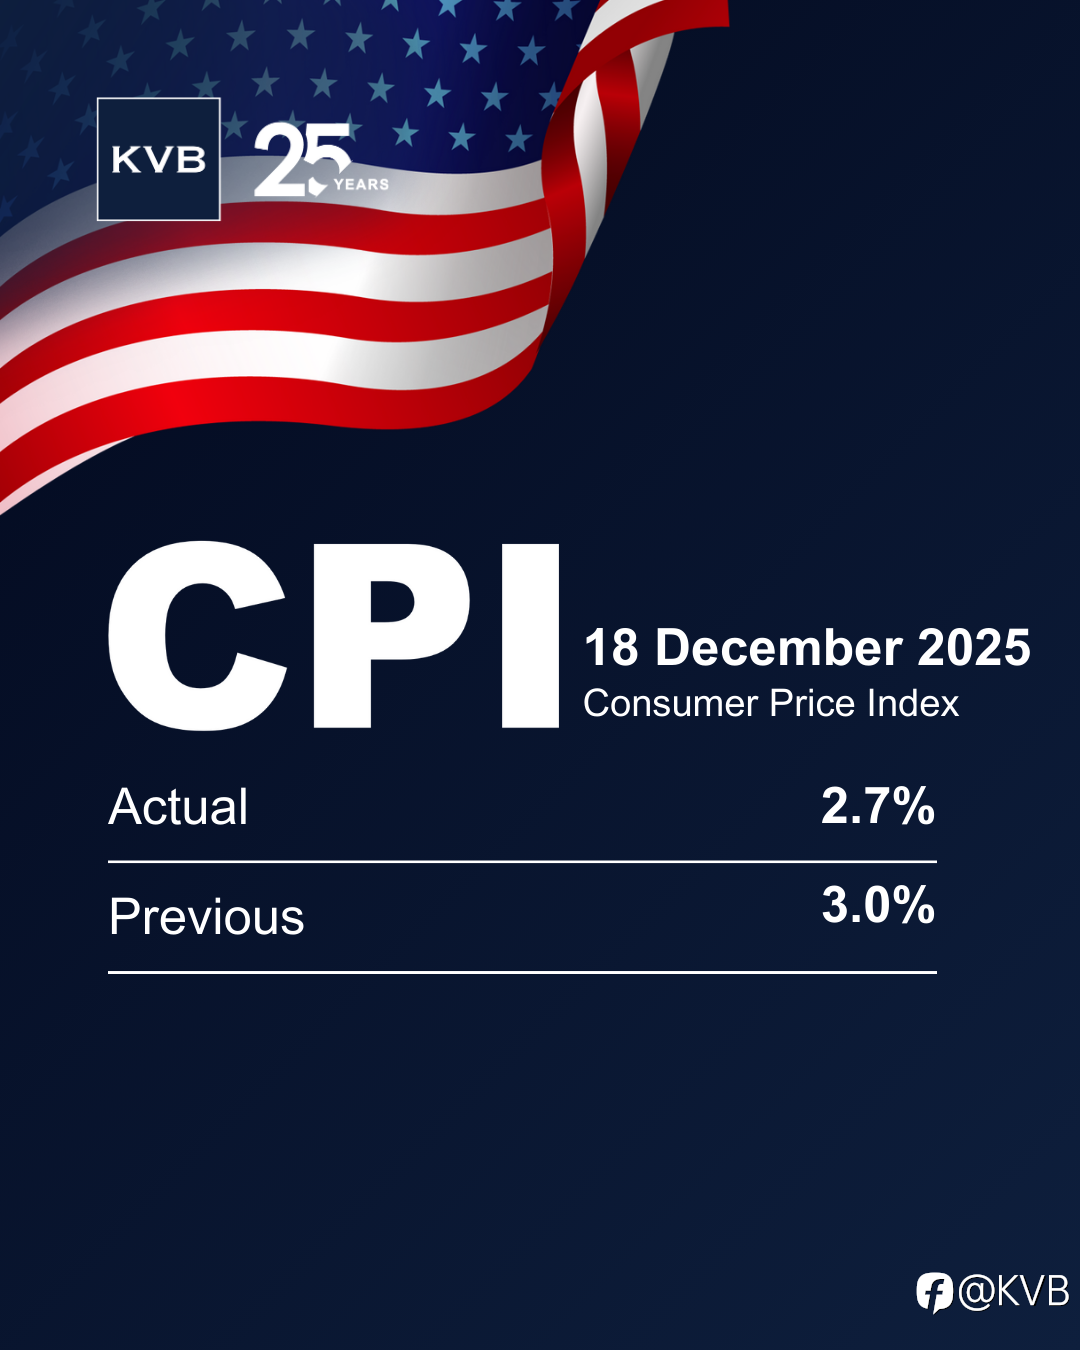
U.S. Annual Inflation Rate (2010 to 2020)

The chart and table above display annual U.S. inflation rates for the years from 2010 to 2020. According to the U.S. Labor Department data published on Dec 10, 2020, the annual inflation rate for the U.S. is 1.2% for the 12 months ended Nov 2020. The next inflation update is scheduled for release on January 13, 2021. It will offer the rate of inflation over the 12 months ended December 2020.
U.S. Unemployment Rate - Seasonally Adjusted (Nov 18 to Nov 20)

The U.S. unemployment rate edged down to 6.7% in November 2020 from the previous month's 6.9 percent and compared with market expectations of 6.8%, as fewer people looked for work. The number of unemployed fell by 326,000 to 10,700,000 and the employment level declined by 74,000 to 149,700,000. The labor force participation rate edged down to 61.5% in November, 1.9% points below its February level.
U.S Dollar Index (2016 to 2020)

BREAKING: Latest News & Updates
(BLOOMBERG) What Will the U.S. Economic Recovery Look Like? - Mar 10, 2021
FOMC Preview: Fed Chair Powell Faces This Tough Question.
#FedStaysatZeroRates##USeconomy##USFederalReserve##CoronavirusVaccine#
(BLOOMBERG) IMF Says Biden Stimulus Plan Could Boost GDP by 5% Over Three Years. - Jan 27, 2021. #BidenStimulus##USeconomy##CoronavirusVaccine#
(Yahoo Finance) 2021 Tech Outlook: What Is the Biggest Risk to The Tech Sector Next Year? - Dec 24, 2020.#marketoutlook2021##facebook##USeconomy#
(BLOOMBERG) Grant Thornton Chief Economis: We Are Losing Momentum at Critical Time. - Dec 24, 2020.#USeconomy##CovidInfection##UnemploymentRate##CoronavirusVaccine#
Latest Analysis

Where Did You Gold? Gold Price Successfully Broke Through the First Target Position!
Economic Calendar 27 April - 01 Mei 2026! 📅

- FajarSwing99 :Thx


- DewiSwing77 :Makasi infonya sgt bermanfaat 🌹
- hope32831 :very good
Bagaimana Data Pengangguran Mempengaruhi Nilai Mata Uang?

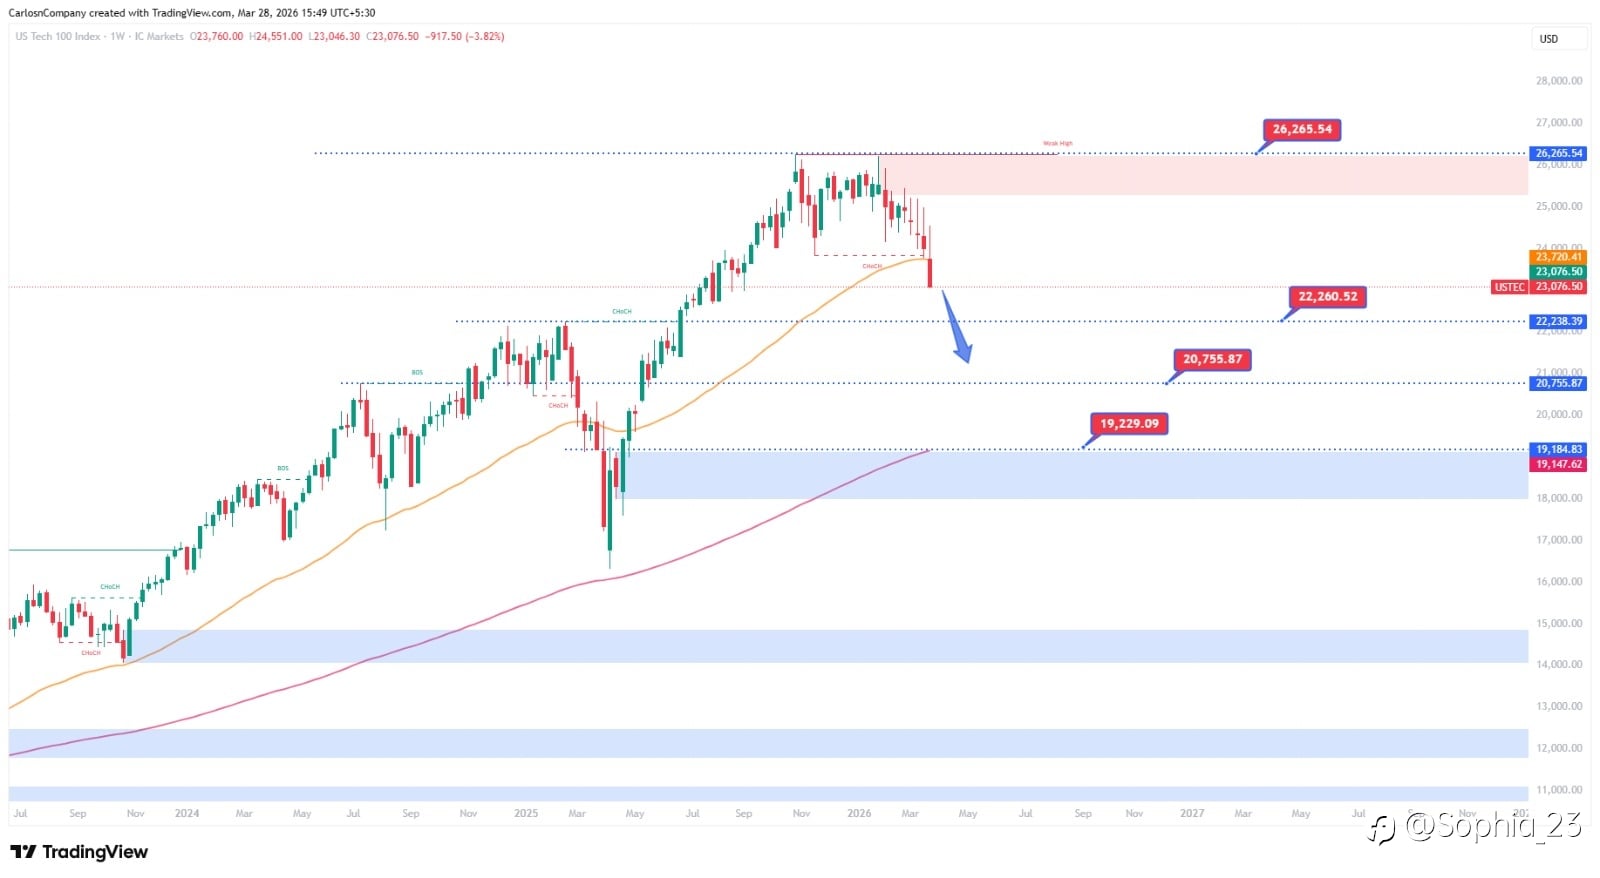
USTEC (Nasdaq)
- mljs :Direct Message