#Fibonacci#
658 Xem
31 Thảo luận
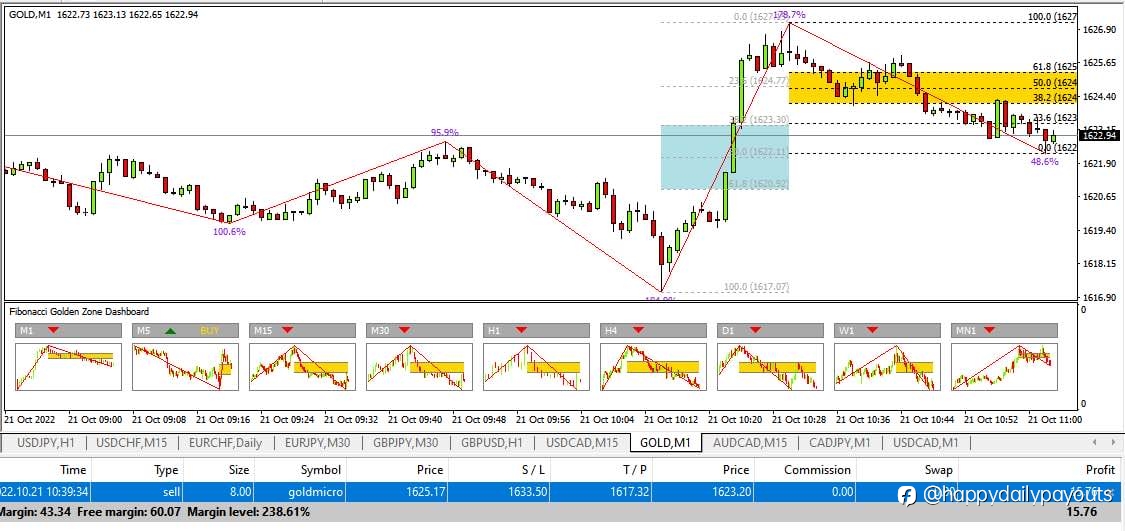
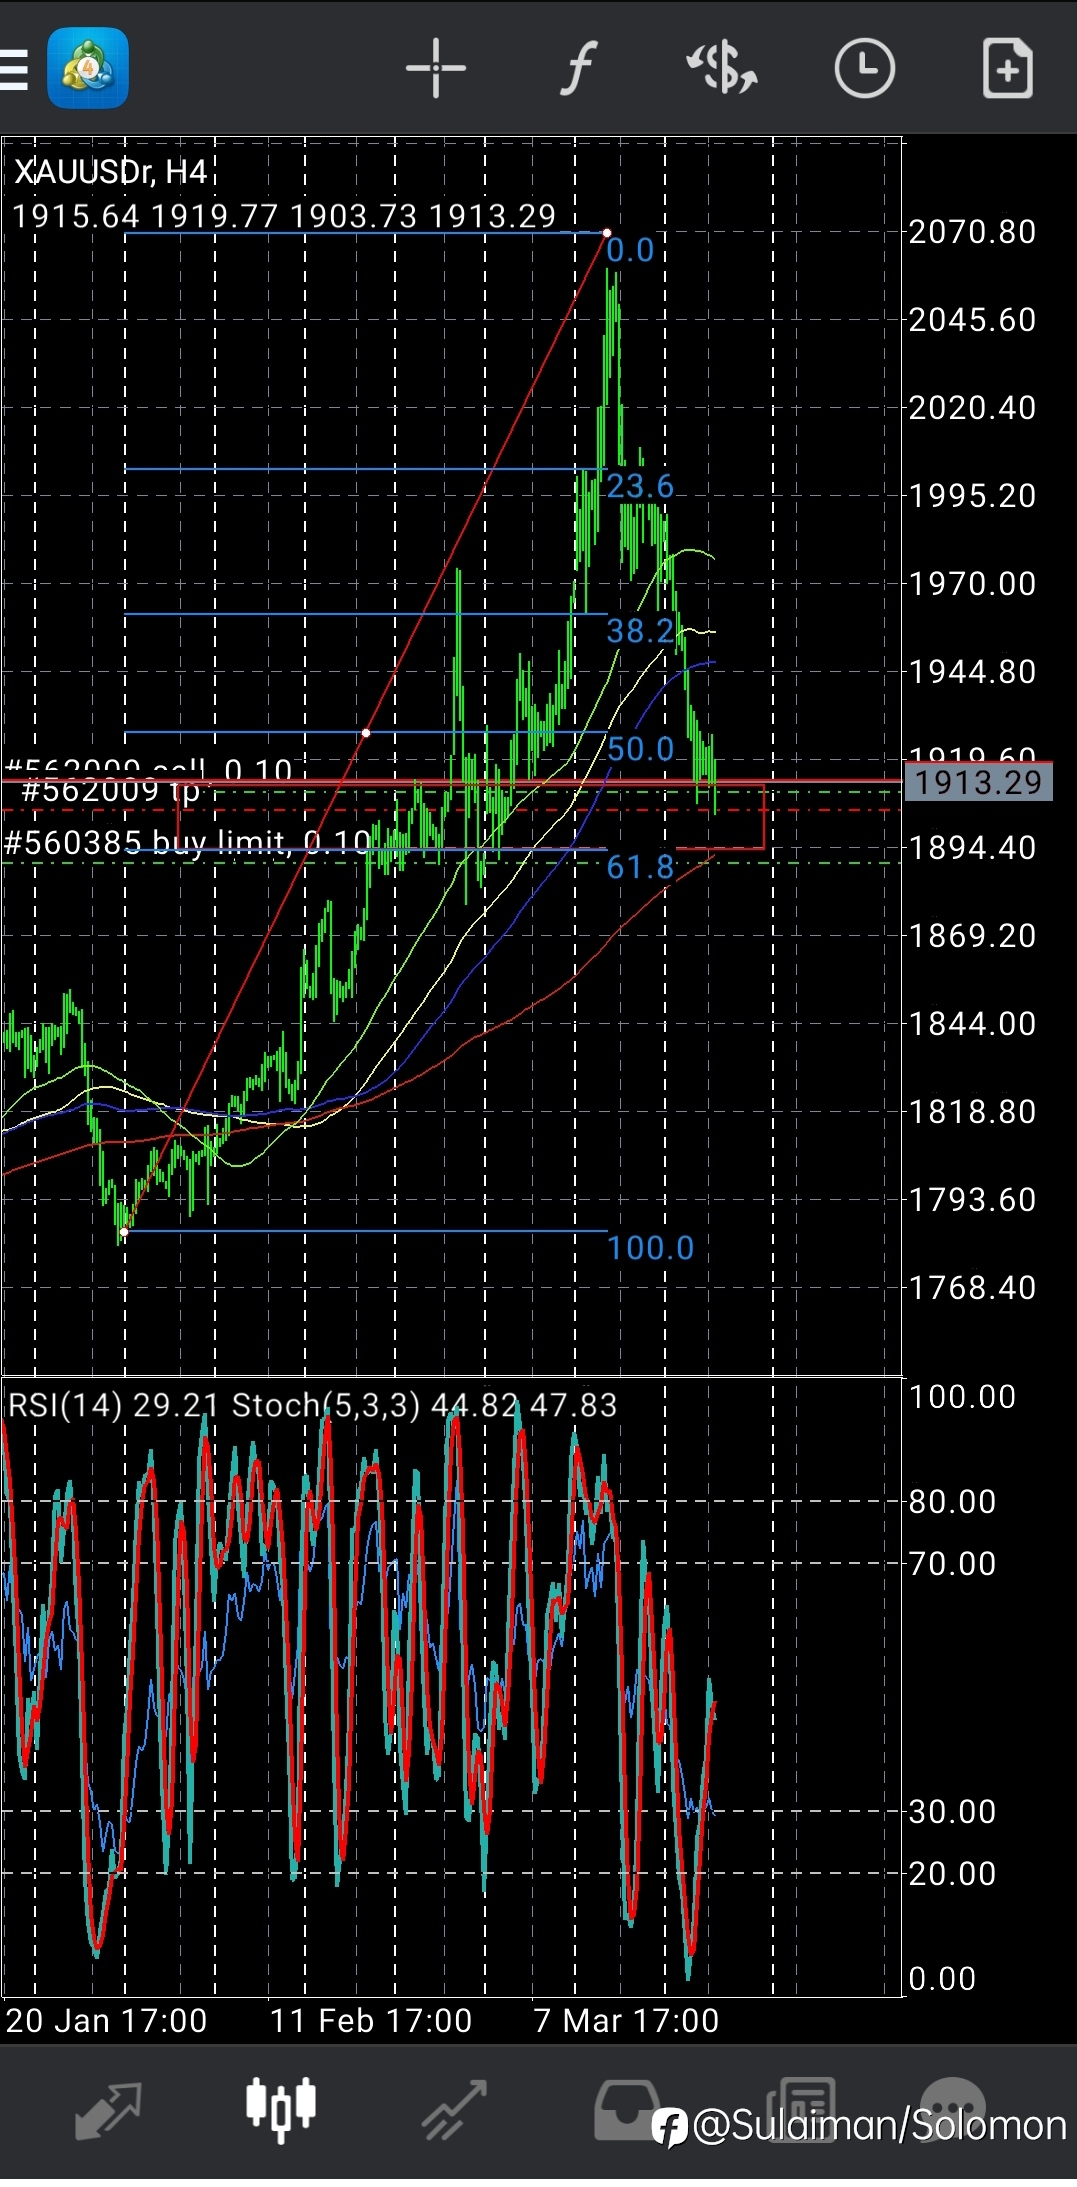
Fibonacci retracement levels are horizontal lines that indicate the possible support and resistance levels where price could potentially reverse direction. It works best when the market is trending. The idea is to go long (or buy) on a retracement at a Fibonacci support level when the market is trending UP. And to go short (or sell) on a retracement at a Fibonacci resistance level when the market is trending DOWN.

38.2 Fibonacci Level Forex Trading Strategy
The Simple 38.2 Fibonacci level forex trading strategy is based on the 38.2 Forex Fibonacci retracement level. Background Sometimes, when the price is in a market uptrend, it will start to reverse back down temporarily until it hits the forex 38.2 Fibonacci retracement level, and then it will bounce


Top Money Management Tips for Forex Traders
Proper money management rules can be really helpful when trading FX, and if you, as a trader, haven’t developed yours yet, there is no time like the present. Although fiat currencies are still the most liquid assets and daily ranges are small, risks still exist and you will face them sooner or later

Silver Price Analysis: 50-SMA probes XAG/USD’s declines towards $21.80
Silver remains pressured around intraday low, battles short-term key SMA support. Descending RSI line, not oversold, directs sellers towards one-week-old horizontal area. $23.40 appears a tough nut to crack for the bulls, yearly low on bear’s radar. Silver (XAG/USD) stays depressed around an intrada

Kapan Laporan Tenaga Kerja ADP AS dan Bagaimana Pengaruhnya Terhadap EUR/USD?
Ikhtisar laporan tenaga kerja ADP AS Kalender ekonomi AS Rabu menyoroti rilis laporan ADP soal ketenagakerjaan sektor swasta, dijadwalkan pada pukul 13:15 GMT (20:15 WIB). Estimasi konsensus mengindikasikan pengusaha sektor swasta AS menambahkan 207 ribu pekerjaan di Januari, menandai penurunan taja
USD/INR Price News: Indian rupee renews 15-week low on USD weakness ahead of US Inflation
USD/INR stays pressured around multi-day bottom after five-day downtrend. India’s active covid cases jump to seven-month high, rising the most since late April. Washington announced public health emergency, Fed’s Powell drowned USD with concerns over balance sheet normalization. World Bank defends 2
Analisis Harga USD/CAD: Penjual Bisa Bergerak di Bawah Garis Tren Mingguan
Penjual USD/CAD mengintai di bawah garis tren pada grafik mingguan dan harian. Penjual akan mencari uji ulang support garis tren mingguan di dekat 1,2520. USD/CAD telah menguji sisi bawah meskipun baru-baru ini pulih. Namun, grafik mingguan melihat harga bergerak ke neckline formasi M. Neckline ters

USD/CAD Menyentuh Terendah Tiga Pekan di Bawah 1,2750 di Tengah Penguatan Minyak dan Pasar yang Tidak Aktif
USD/CAD menerima penawaran jual untuk menyentuh terendah baru multi-hari, turun untuk 3 hari berturut-turut. Harga minyak diuntungkan oleh optimisme hati-hati mengenai Omicron dan ketakutan geopolitik. Quebec menetapkan jam malam untuk memperlambat peningkatan virus, laporan AS mencatat kasus COVID