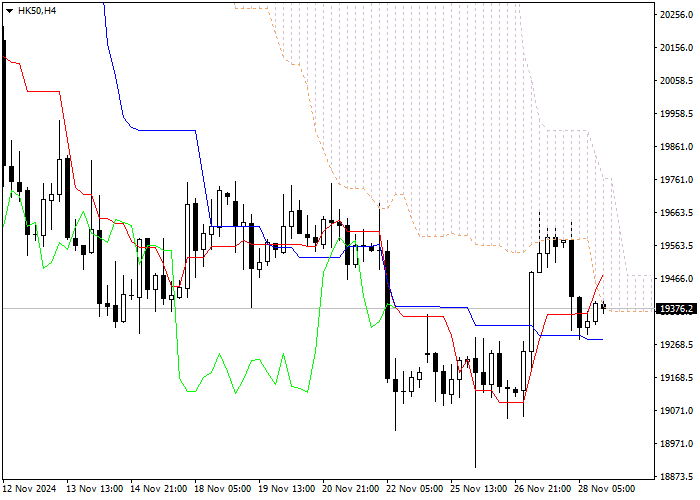
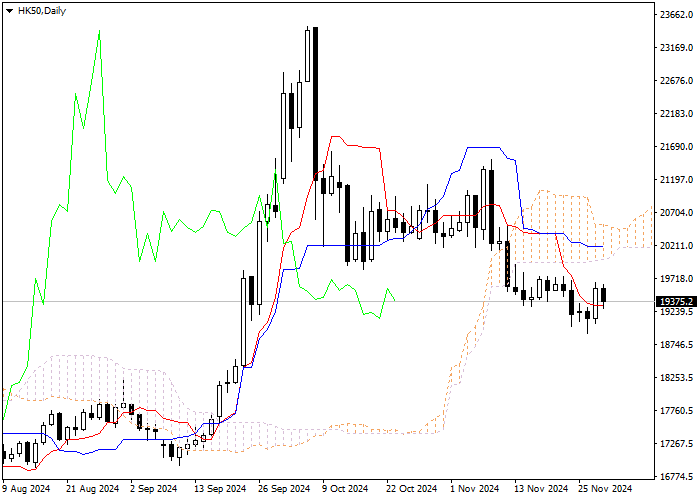
ScenarioTimeframeWeeklyRecommendationSELLEntry Point19375.2Take Profit17005.0Stop Loss20196.9Key Levels19123.4, 19722.5, 18468.0, 20196.9Let's look at the four-hour chart. Tenkan-sen line is above Kijun-sen, the red line is directed upwards, while the blue one remains horizontal. Confirmative line C